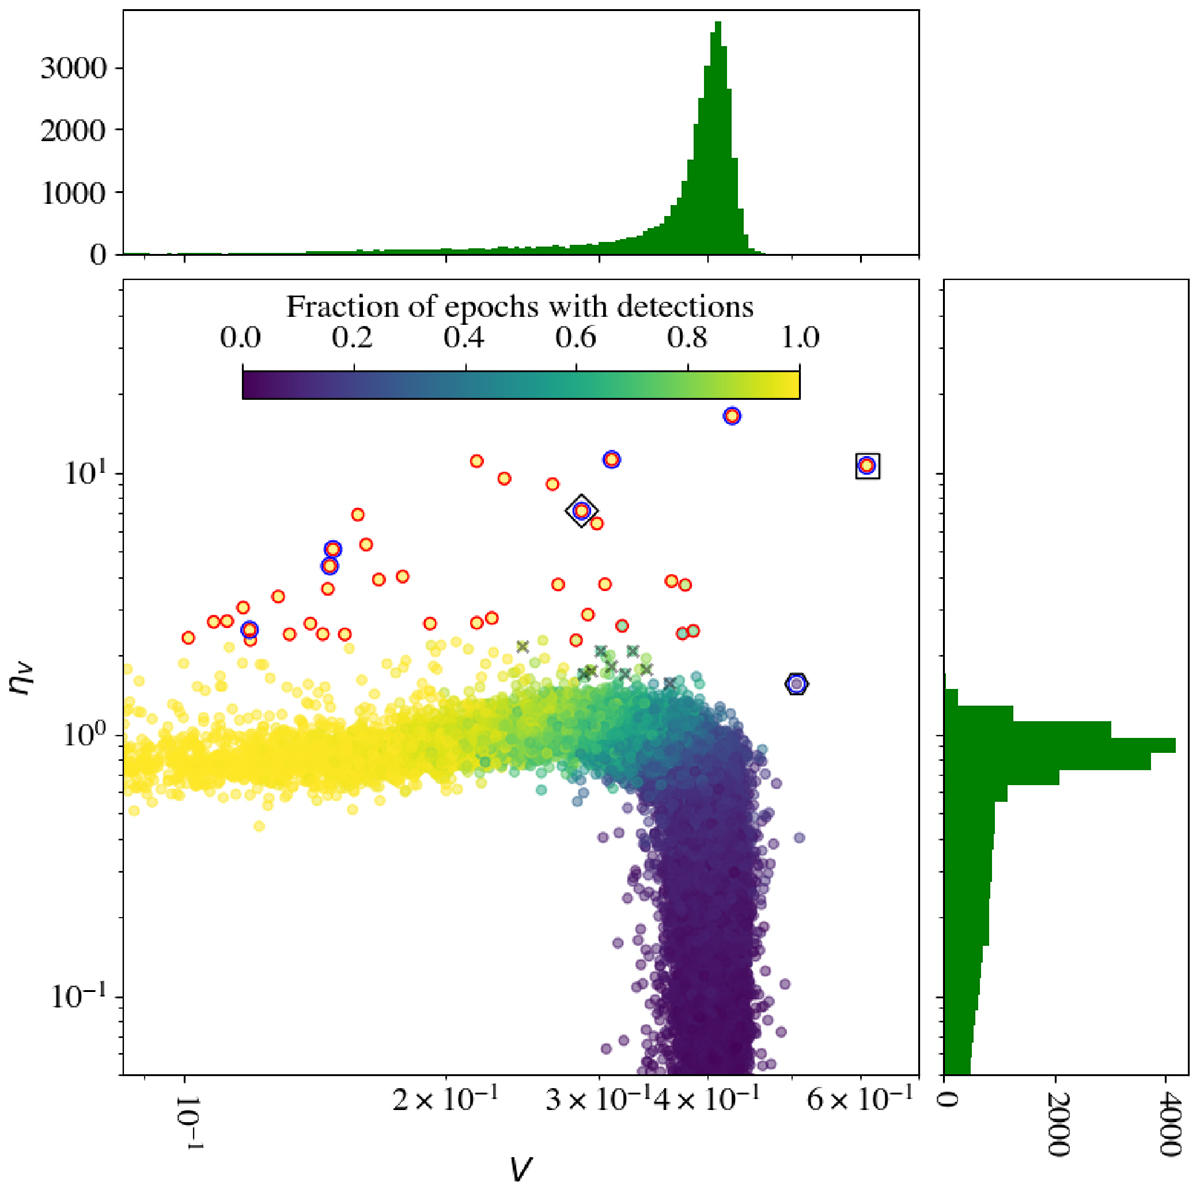
Fig. 13.
Download original image
Derived variability parameters V and η for the 37 676 sources detected in at least one epoch. The marker colour shows the fraction of epochs in which the source is detected. More variable sources have high values of V and η. The 38 candidate variable sources are circled in red and the sources shown in Fig. 15 are circled in blue. The box, diamond and hexagon show Cr Draconis, PSR J1552+5437 and GJ 625 respectively. The grey x’s show additional candidate variable sources identified when using Gaussian rather than uniform probability distributions for non detections (see text).
Current usage metrics show cumulative count of Article Views (full-text article views including HTML views, PDF and ePub downloads, according to the available data) and Abstracts Views on Vision4Press platform.
Data correspond to usage on the plateform after 2015. The current usage metrics is available 48-96 hours after online publication and is updated daily on week days.
Initial download of the metrics may take a while.