Fig. 12.

Download original image
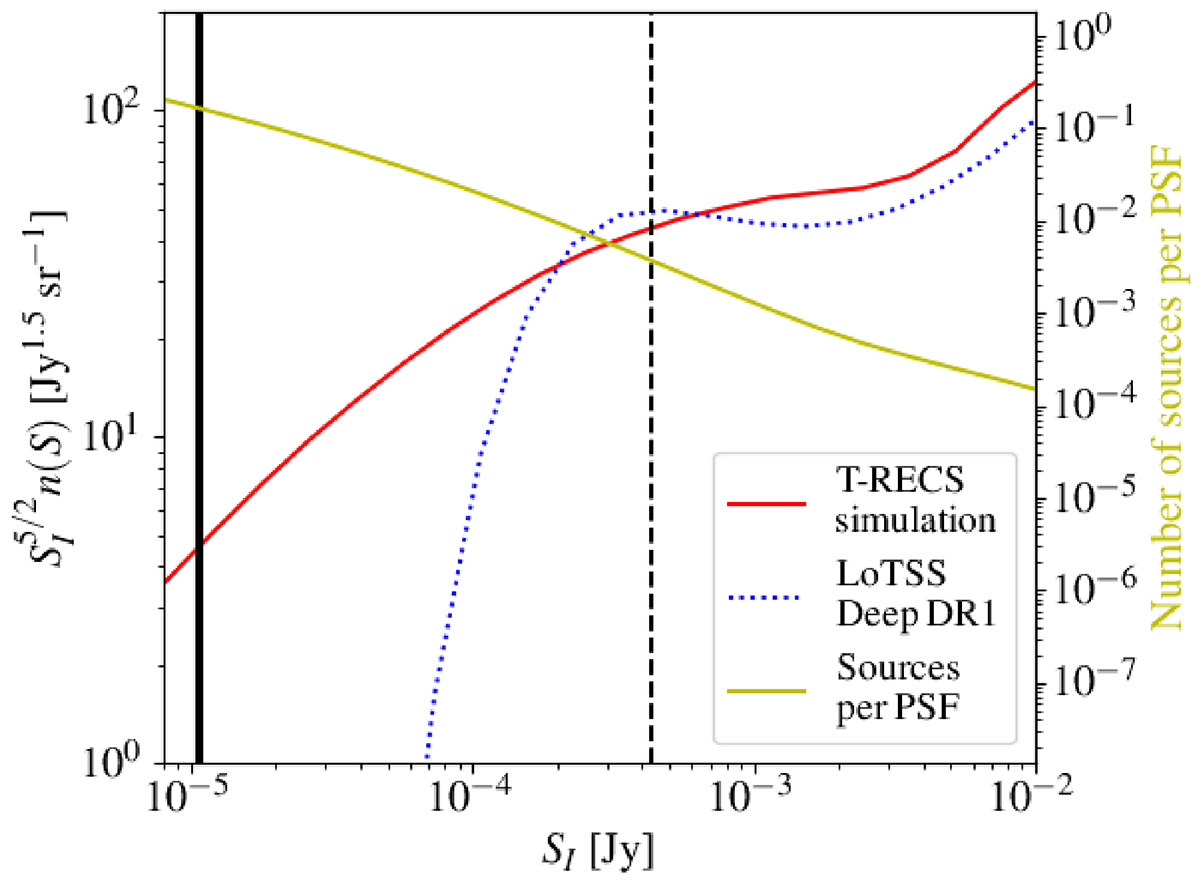
Euclidean normalised source counts at 144 MHz (y-axis on the left) from previous surveys and simulations. The dashed blue line shows the counts from Mandal et al. (2021) who used the previous LoTSS Deep fields data release. The solid red line shows the counts from a T-RECS (Bonaldi et al. 2023) simulation at 144 MHz. The Mandal et al. (2021) counts drop rapidly at low flux densities due to the limited depth of the previous LoTSS Deep data release images. Hence in our confusion noise simulations (Sect. 4.2), we have extrapolated the Mandal et al. (2021) counts below 0.43 mJy (shown by vertical dashed black line) with the T-RECS counts. The yellow line shows the number of sources above a given flux density per 6″ restoring beam (y-axis on the right) and the thick vertical black line shows the sensitivity of our final deep ELAIS-N1 6″ image. Source counts derived from LoTSS Deep DR2 will be presented in a future study.
Current usage metrics show cumulative count of Article Views (full-text article views including HTML views, PDF and ePub downloads, according to the available data) and Abstracts Views on Vision4Press platform.
Data correspond to usage on the plateform after 2015. The current usage metrics is available 48-96 hours after online publication and is updated daily on week days.
Initial download of the metrics may take a while.


