Fig. 11.
Download original image
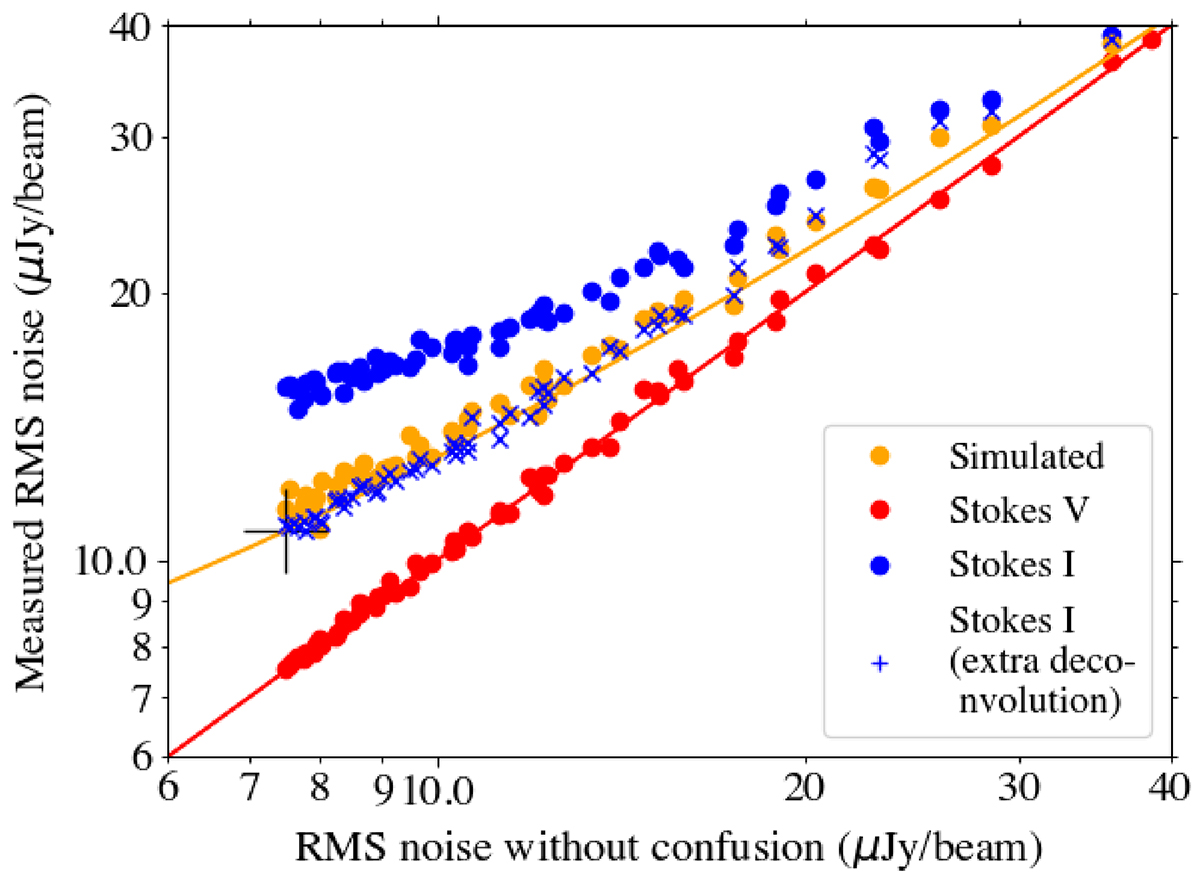
Impact of confusion noise at 144 MHz and 6″ resolution. The blue crosses and circles show the noise measured from our stacked Stokes I residual images with and without image-plane deconvolution of sources that would be detected and deconvolved if the uv-data were imaged together. The orange circles show the measurements from our simulations that are fit with σIRMS = 0.9σVRMS + 5.7 × 10⁻⁴σVRMS2 + 3.96. Here σIRMS is the measured Stokes I sensitivity (root mean square noise) and σVRMS is the sensitivity without confusion, both are in micro Janskys per beam. In red are the measurements from our stacked Stokes V maps. The y-axis shows the total noise measured from stacked DDFacet residual images whereas the x-axis shows the thermal noise estimated from the weights of the Stokes V images for datasets included in that stacked image. The red line shows where these are equal and the large black cross is the sensitivity of our final ELAIS-N1 6″ resolution image.
Current usage metrics show cumulative count of Article Views (full-text article views including HTML views, PDF and ePub downloads, according to the available data) and Abstracts Views on Vision4Press platform.
Data correspond to usage on the plateform after 2015. The current usage metrics is available 48-96 hours after online publication and is updated daily on week days.
Initial download of the metrics may take a while.