Fig. 10.
Download original image
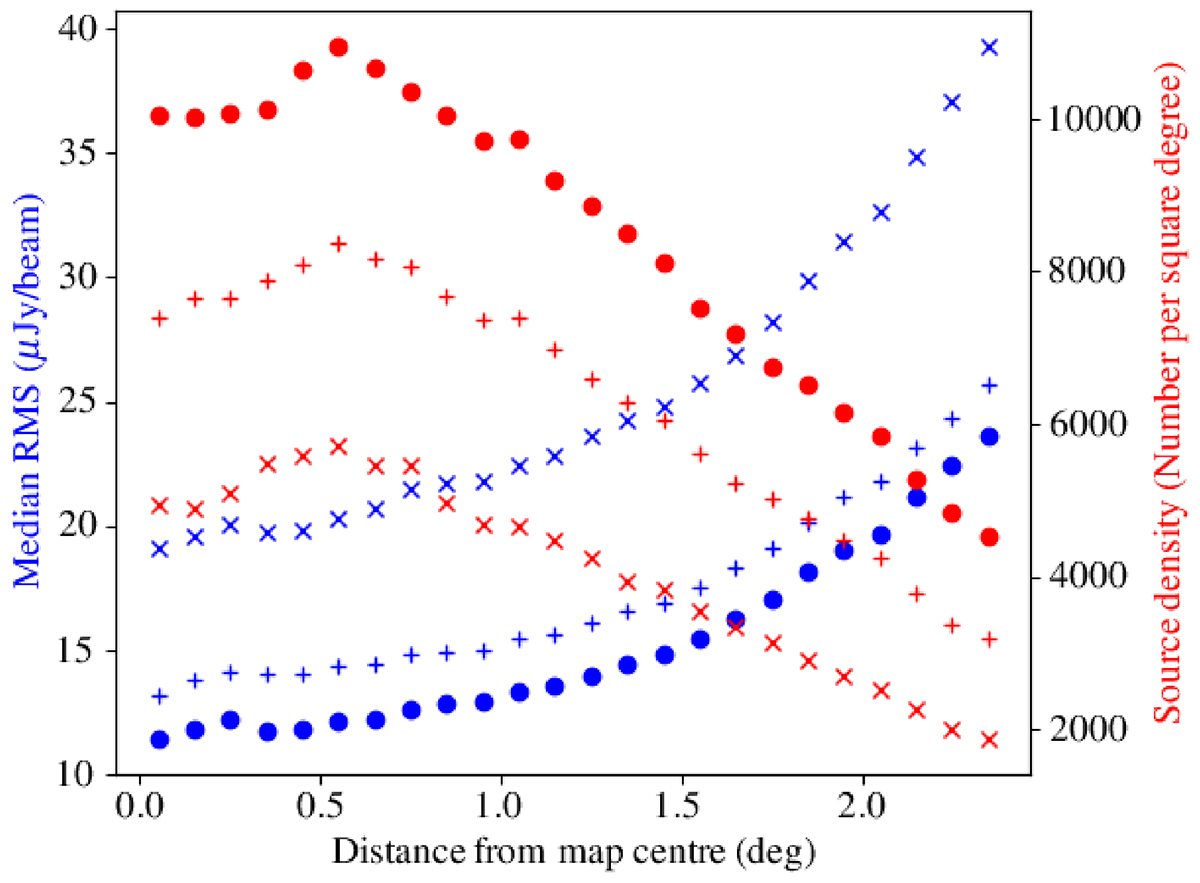
Source density (red) and the image RMS (blue) as a function of distance from the pointing centre. The x symbols show the values derived from the previous release of the LoTSS Deep ELAIS-N1 field (Sabater et al. 2021), the + symbols show the values derived from our image using the exact same PYBDSF parameters as Sabater et al. (2021) and the circular symbols show the values derived using our revised PYBDSF strategy described in Sect. 2.1.
Current usage metrics show cumulative count of Article Views (full-text article views including HTML views, PDF and ePub downloads, according to the available data) and Abstracts Views on Vision4Press platform.
Data correspond to usage on the plateform after 2015. The current usage metrics is available 48-96 hours after online publication and is updated daily on week days.
Initial download of the metrics may take a while.