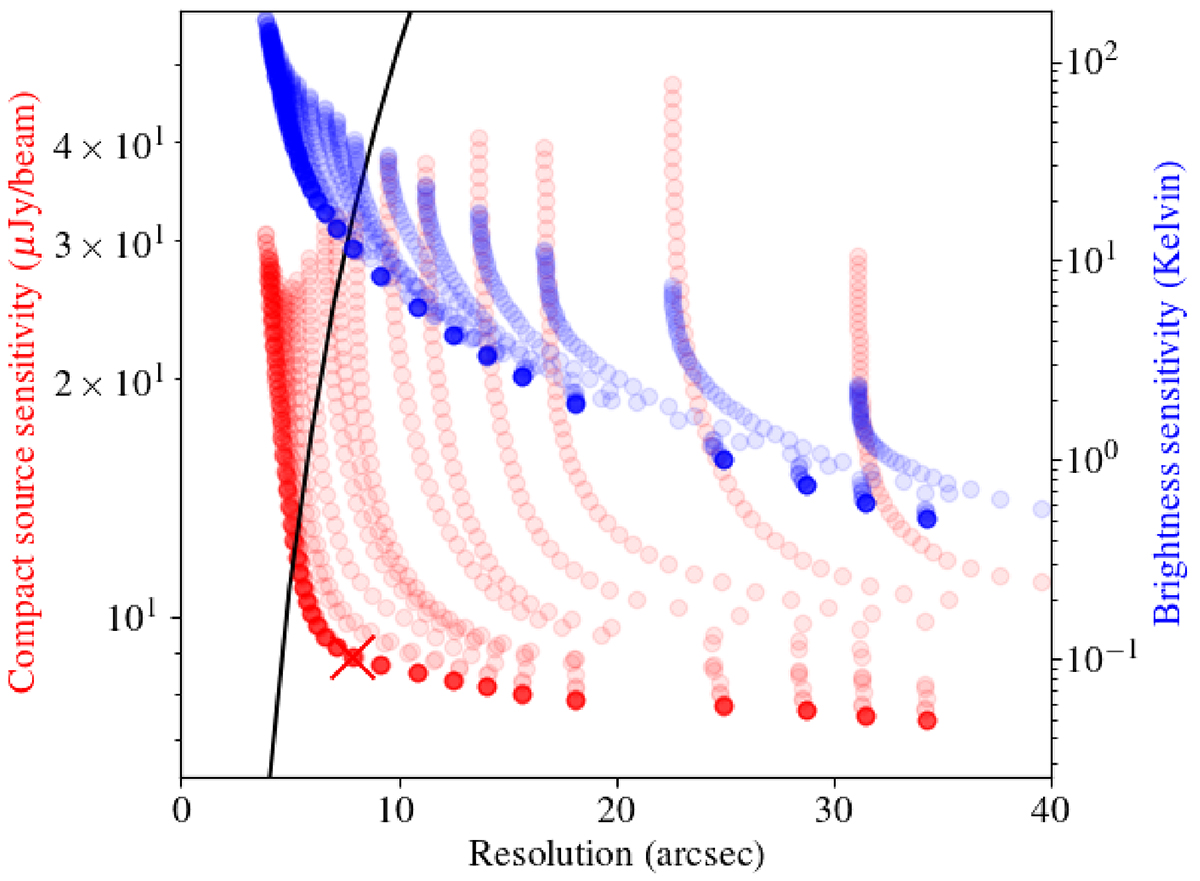
Fig. 1.
Download original image
Expected compact source sensitivity (red) and brightness sensitivity (blue) as a function of imaging resolution for the 122–124 MHz data from observation 798146. The resolution is varied by altering the visibility weightings with robust and tapering settings. The black curve shows the anticipated confusion noise (defined as 1 source per 10 resolution elements). The red cross shows the location of the 6″ resolution imaging parameters we have used (robust = − 0.5, no taper). Only a small dataset was used for this analysis to limit the computational cost.
Current usage metrics show cumulative count of Article Views (full-text article views including HTML views, PDF and ePub downloads, according to the available data) and Abstracts Views on Vision4Press platform.
Data correspond to usage on the plateform after 2015. The current usage metrics is available 48-96 hours after online publication and is updated daily on week days.
Initial download of the metrics may take a while.