Open Access
Fig. 5
Download original image
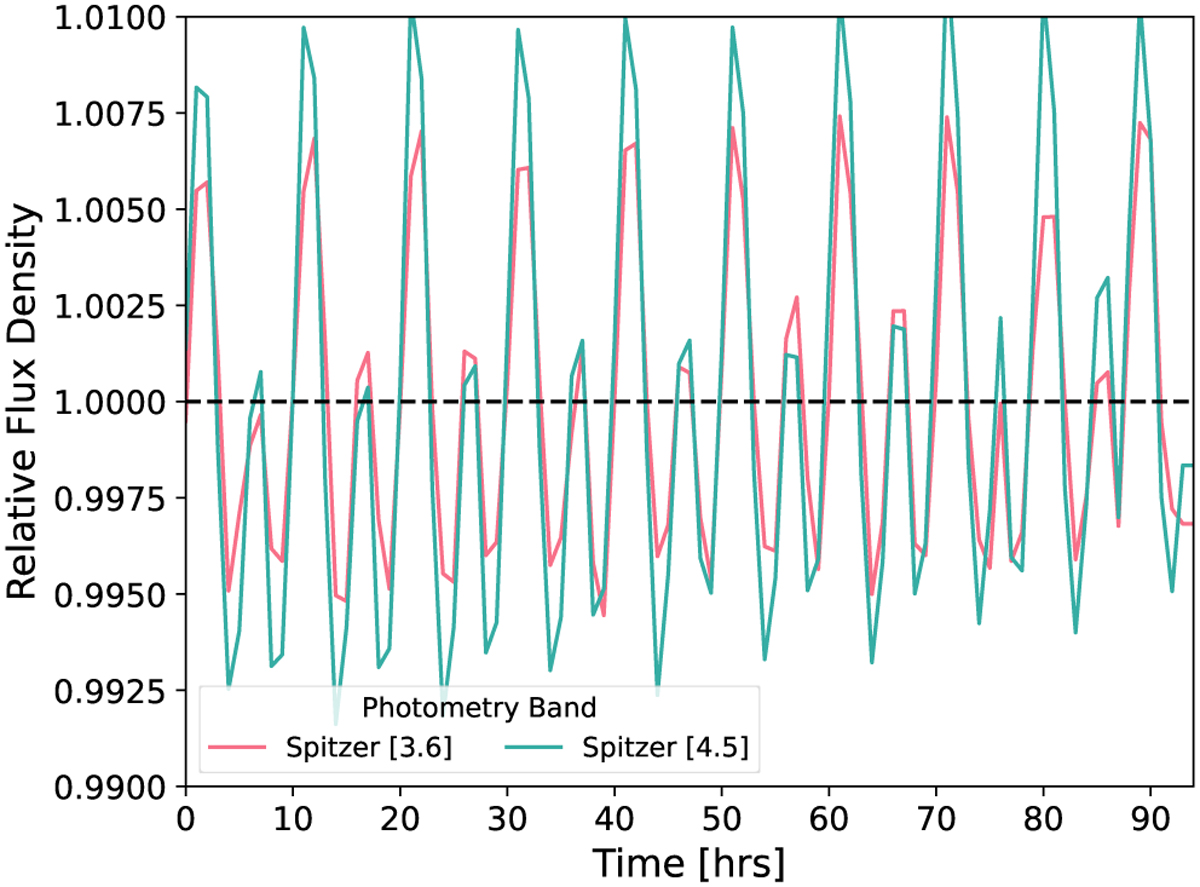
Relative flux density for the Spitzer [3.6] and [4.5] bands produced from the last 96 hours of the GCM simulation, at an inclination of 90°. This shows a 10-hour peak-to-peak rotational component with ~0.5–1% variability. Small-scale inter-rotational periodic variability is also seen in the model.
Current usage metrics show cumulative count of Article Views (full-text article views including HTML views, PDF and ePub downloads, according to the available data) and Abstracts Views on Vision4Press platform.
Data correspond to usage on the plateform after 2015. The current usage metrics is available 48-96 hours after online publication and is updated daily on week days.
Initial download of the metrics may take a while.