Open Access
Fig. A.1.
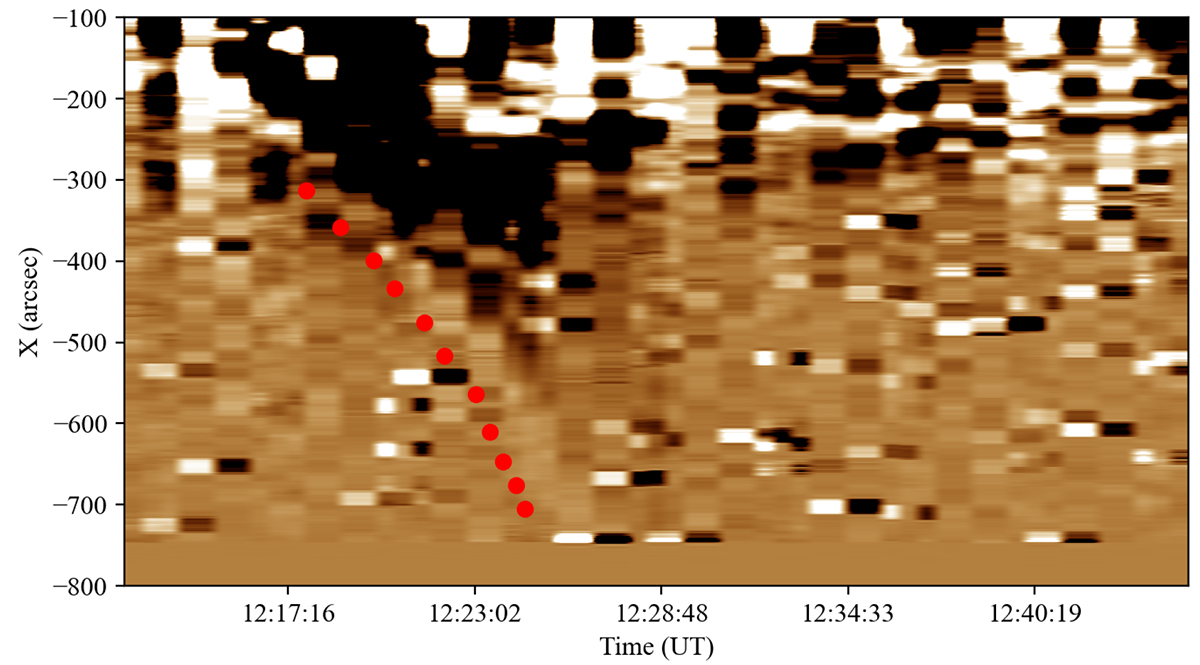
Download original image
Slit applied to SUVI 195 Å running difference images in the direction of the mid-point of the CME propagating radially outwatds. The red dots denote the faint outer edge of the CME eruption in the EUV images that were used to estimate its radial outwards speed using a linear regression fit.
Current usage metrics show cumulative count of Article Views (full-text article views including HTML views, PDF and ePub downloads, according to the available data) and Abstracts Views on Vision4Press platform.
Data correspond to usage on the plateform after 2015. The current usage metrics is available 48-96 hours after online publication and is updated daily on week days.
Initial download of the metrics may take a while.