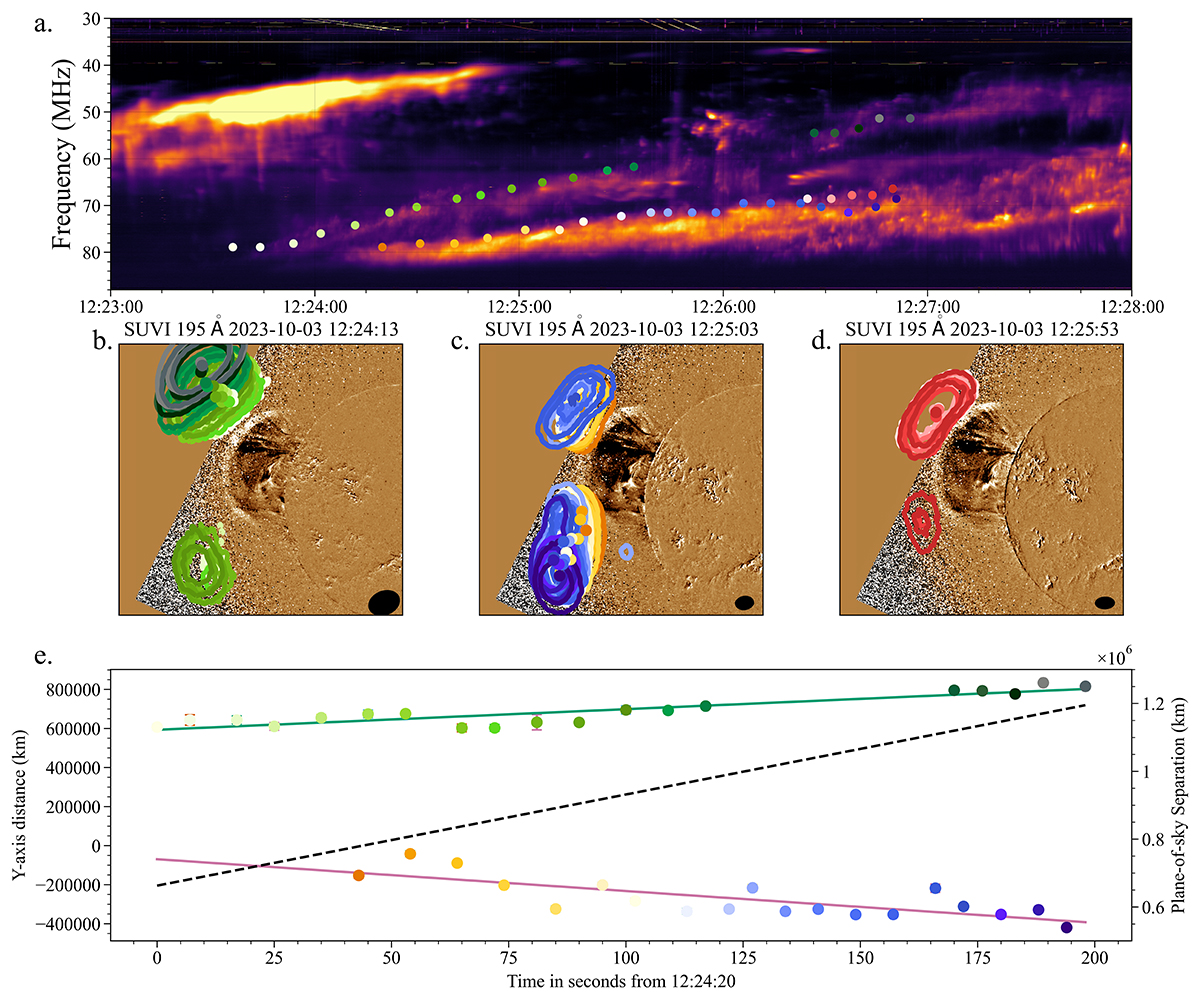
Fig. 3.
Download original image
Zoomed-in dynamic spectrum of the type II burst and images of the source location along the leading edge of the two lanes. The top panel shows the start of the harmonic type II lanes in the LBA dynamic spectrum. The color-coded dots track the leading edges of the two lanes. The middle panels show the color-coded contours of the source locations for both lanes overlaid on GOES/SUVI 195 Å running difference images of the CME eruption. The contour levels are at 50 and 70% of the maximum intensity in each image. The bottom panel shows the Y-axis distance between the two radio sources using the same colour-coding and their separation as a black dashed line.
Current usage metrics show cumulative count of Article Views (full-text article views including HTML views, PDF and ePub downloads, according to the available data) and Abstracts Views on Vision4Press platform.
Data correspond to usage on the plateform after 2015. The current usage metrics is available 48-96 hours after online publication and is updated daily on week days.
Initial download of the metrics may take a while.