Fig. 2.
Download original image
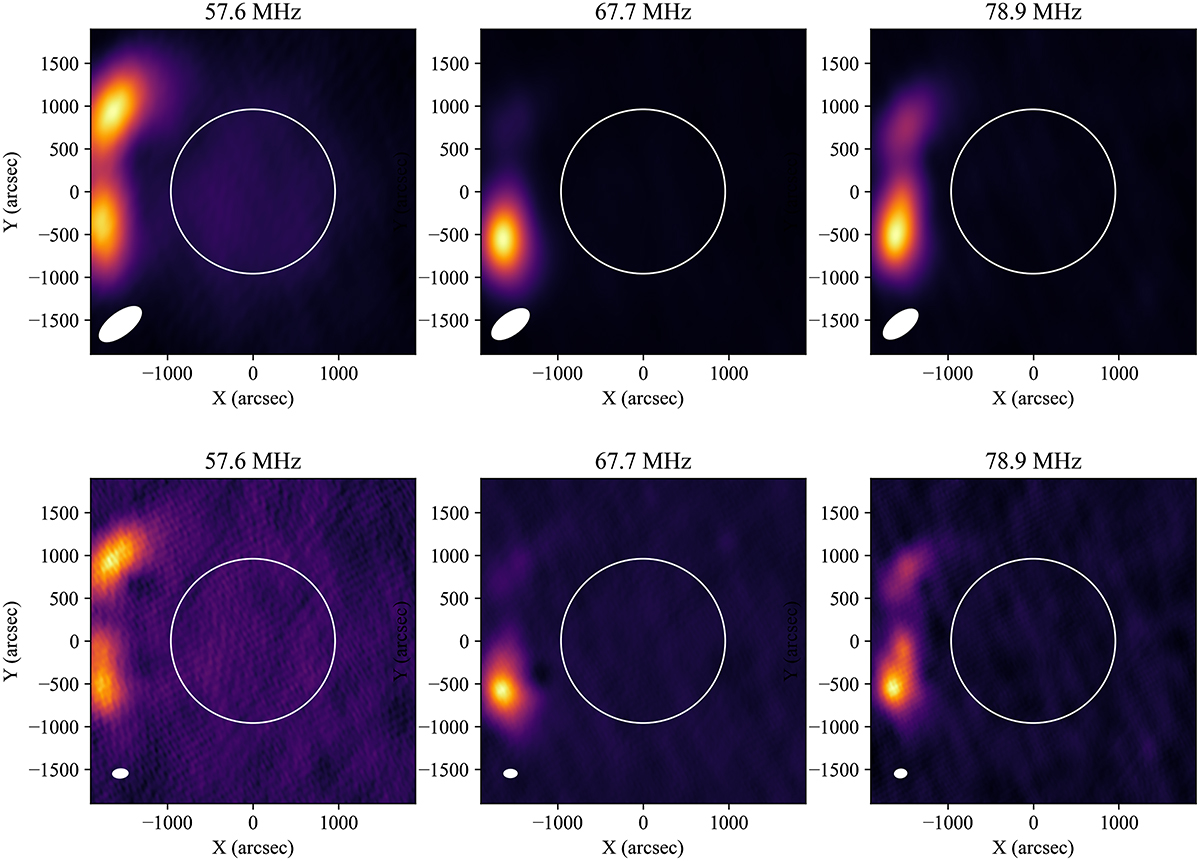
Radio images of the type II burst using two different baselines. The images are at 12:25:34 UT, time which is marked as a white dashed line in the dynamic spectrum in Fig. 1, and cover three frequency subbands: 57.6, 67.7 and 78.9 MHz, from left to right, respectively. The top panels make use of a baseline of 15 and 10 km, while the bottom panels have a larger baseline of 20 and 32 km, in the East-West and north-south directions, respectively. The size of the beam corresponding to each frequency subband and baseline is shown in the bottom left corner of each panel. In this paper, we present a comprehensive analysis on the spatial properties of a multi-lane type II radio burst and associated shock wave using new and unprecedented high-resolution radio imaging observations with LOFAR.
Current usage metrics show cumulative count of Article Views (full-text article views including HTML views, PDF and ePub downloads, according to the available data) and Abstracts Views on Vision4Press platform.
Data correspond to usage on the plateform after 2015. The current usage metrics is available 48-96 hours after online publication and is updated daily on week days.
Initial download of the metrics may take a while.