Fig. 8
Download original image
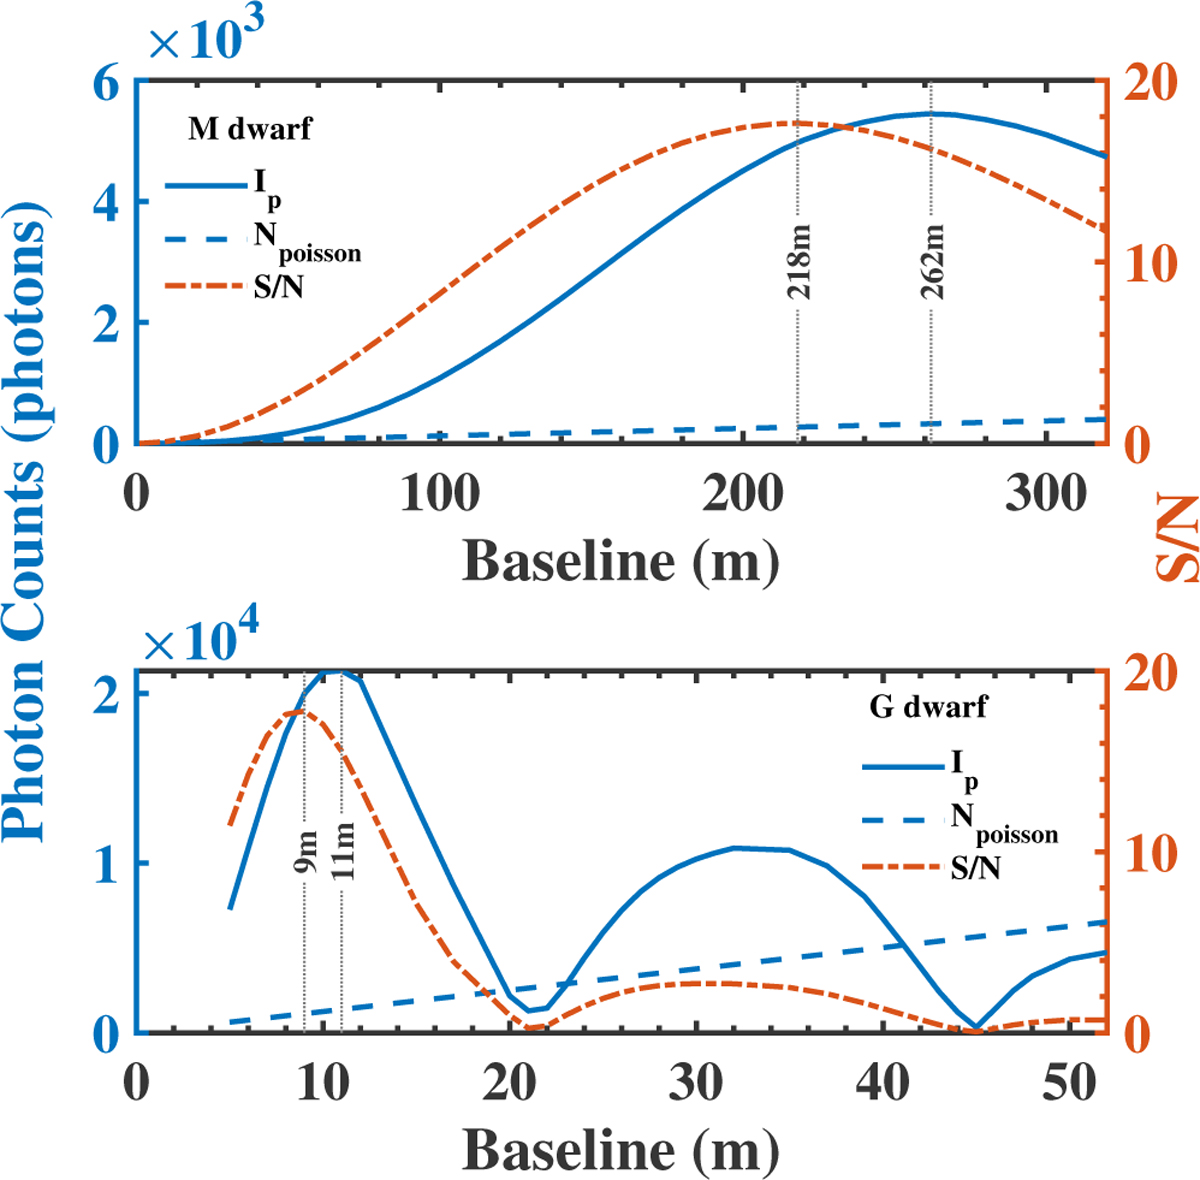
Variation in the planetary signal (solid blue line), stellar Poisson noise (dashed blue line), and the S/N (dashed red line) as the baseline length changes. The gray dotted lines indicate the baseline lengths for M-dwarfs (top) and G-type (bottom) stars at which the signals for detecting habitable planets or the S/N are at maximum. Note: the total exposure time for a M dwarf is 5000 s, compared to 20 000 s for a G dwarf.
Current usage metrics show cumulative count of Article Views (full-text article views including HTML views, PDF and ePub downloads, according to the available data) and Abstracts Views on Vision4Press platform.
Data correspond to usage on the plateform after 2015. The current usage metrics is available 48-96 hours after online publication and is updated daily on week days.
Initial download of the metrics may take a while.