Fig. 7
Download original image
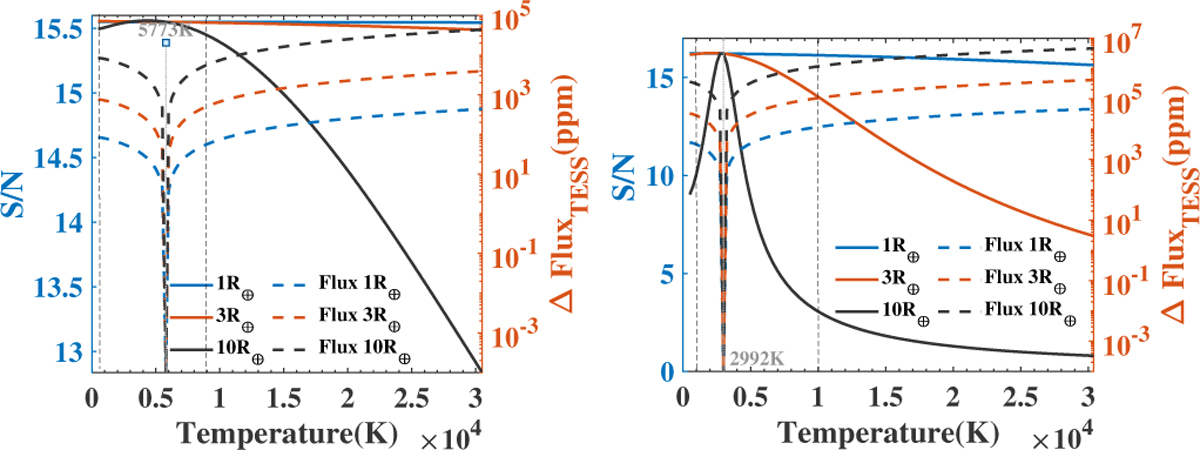
Temperature of activity regions versus S/N and flux enhancement in the TESS observation band for active regions. The solid blue, red, and black lines represent the S/N of planet single with different active regions radii of 1, 3, and 10 R⊕ , respectively. The dashed blue, red, and black lines indicate the flux enhancement due to stellar activity in the TESS observation band for active regions with the same radii. The left and right panels show the results on G and M dwarfs, respectively. The vertical lines represent the temperature of 1000 (spots) and 10 000 K (flares), as well as the stellar effective temperature.
Current usage metrics show cumulative count of Article Views (full-text article views including HTML views, PDF and ePub downloads, according to the available data) and Abstracts Views on Vision4Press platform.
Data correspond to usage on the plateform after 2015. The current usage metrics is available 48-96 hours after online publication and is updated daily on week days.
Initial download of the metrics may take a while.