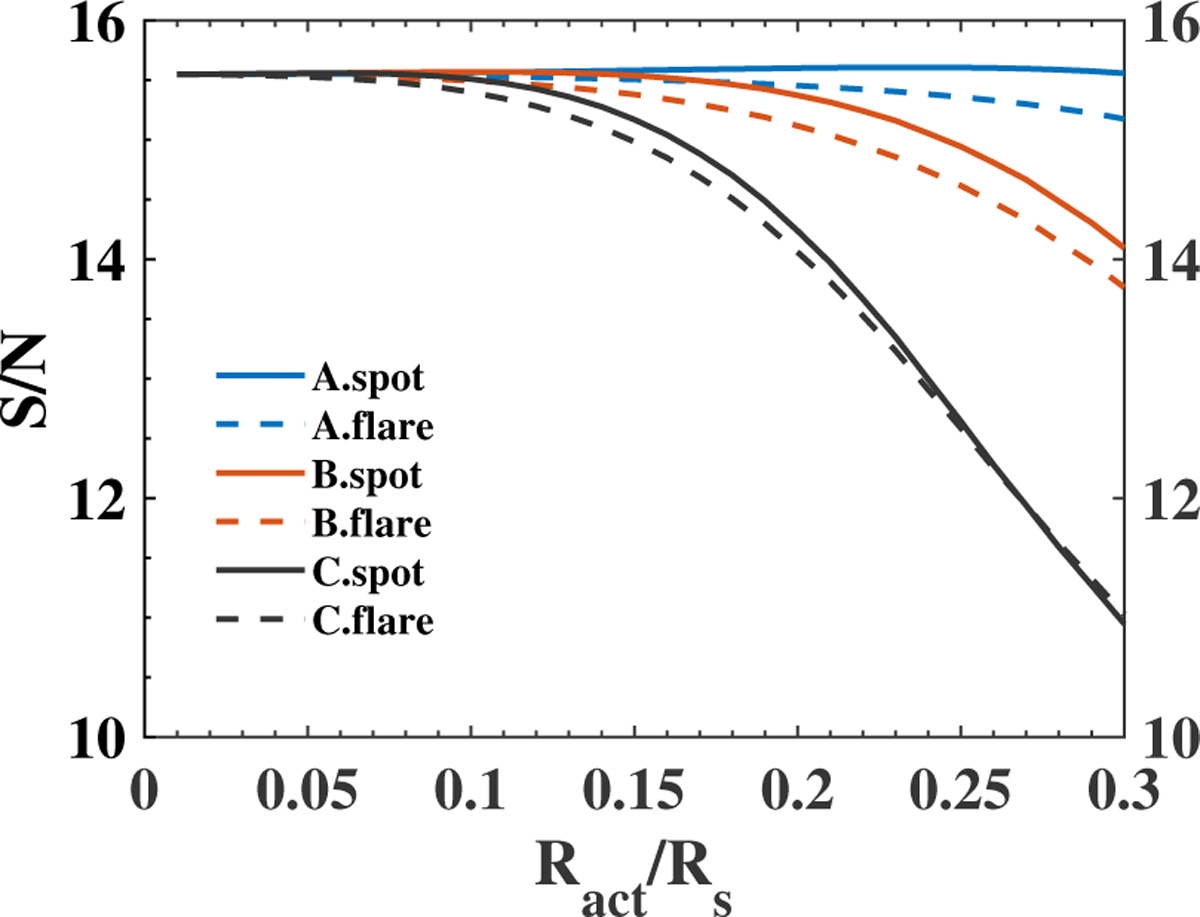
Fig. 6
Download original image
Relationship between the size of active regions and the S/N on G dwarf stars. The X-axis is the ratio of the radius of the stellar activity region to the stellar radius. Solid lines represent spots with temperatures of 1000 K. Dashed Lines represent flares of 10 000 K. The symbols A, Bm and C represent the position of active regions, as shown in Fig. 4.
Current usage metrics show cumulative count of Article Views (full-text article views including HTML views, PDF and ePub downloads, according to the available data) and Abstracts Views on Vision4Press platform.
Data correspond to usage on the plateform after 2015. The current usage metrics is available 48-96 hours after online publication and is updated daily on week days.
Initial download of the metrics may take a while.