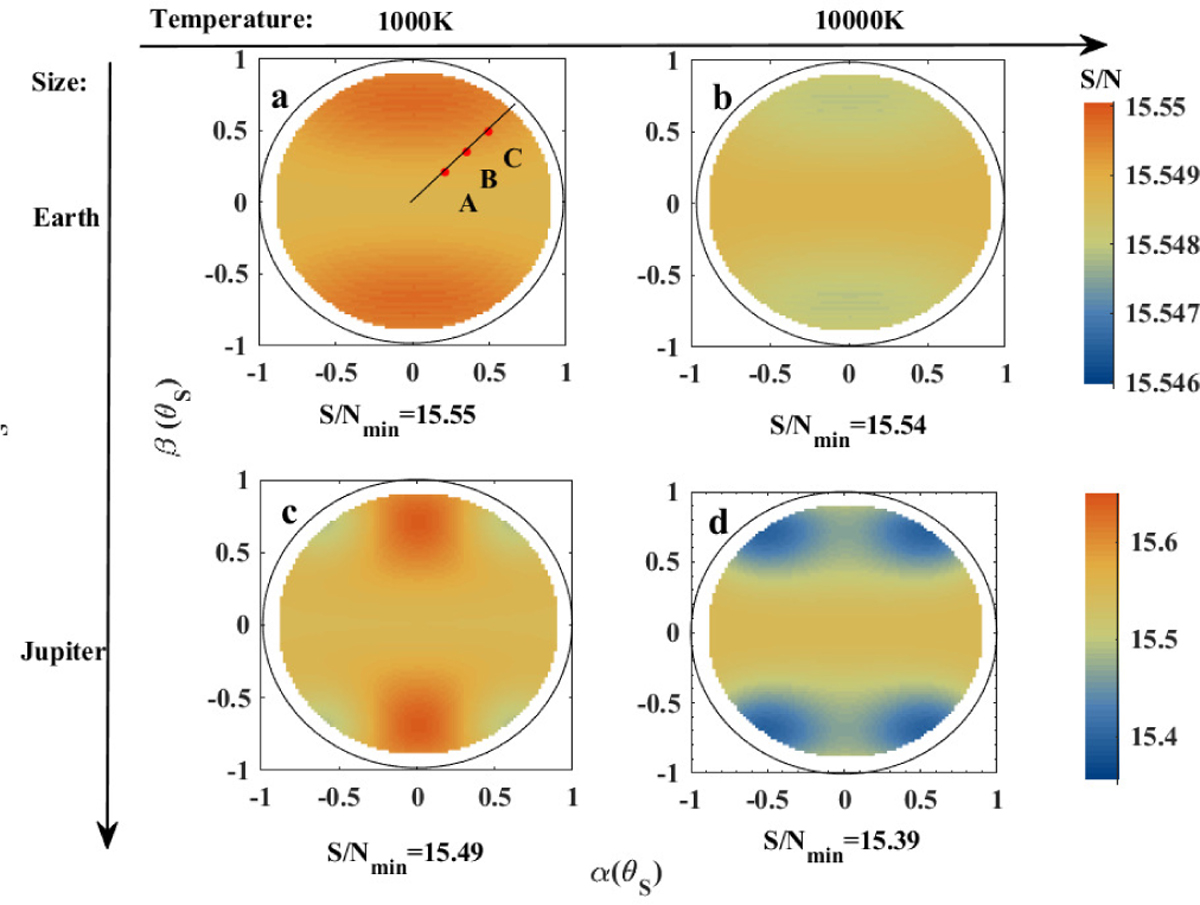
Fig. 4
Download original image
S/N values of planets when the stellar active region is located at different positions on G dwarf stars. Upper panels represent the Earthsize active region with temperatures of 1000 and 10000 K for spots and flares, respectively. Bottom panels represent the Jupiter-size active region of spots and flares. Points A, B, and C in panel a represent the position chosen to plot in Fig. 6.
Current usage metrics show cumulative count of Article Views (full-text article views including HTML views, PDF and ePub downloads, according to the available data) and Abstracts Views on Vision4Press platform.
Data correspond to usage on the plateform after 2015. The current usage metrics is available 48-96 hours after online publication and is updated daily on week days.
Initial download of the metrics may take a while.