Fig. 3
Download original image
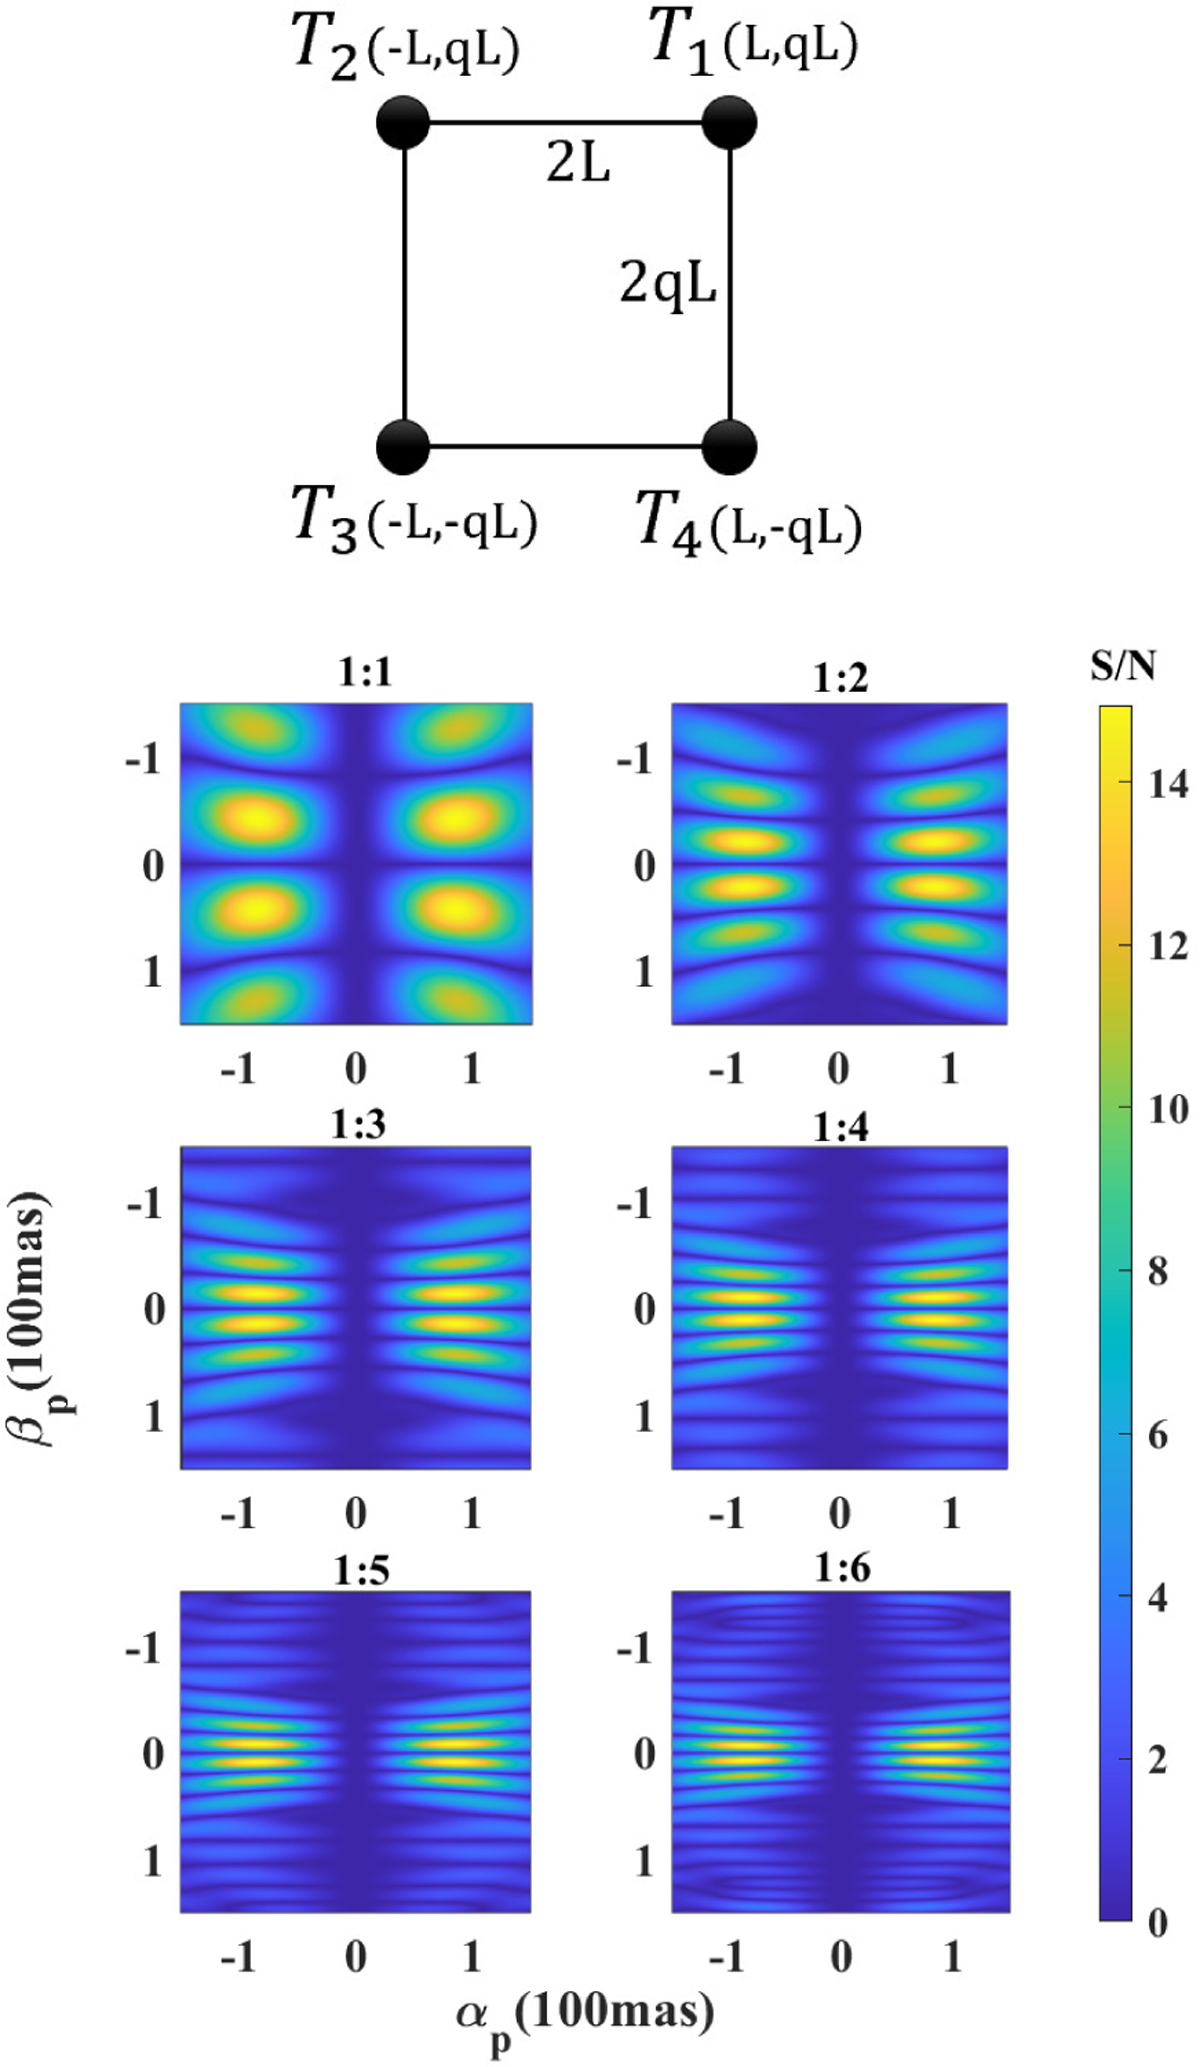
Top sketching map shows the configuration adopted here and hereafter (corresponding to the transfer matrix in Eq. (6) from Hansen et al. 2022). The color maps show the distribution of the S/N for an interferometer detecting an Earth-like planet around a G-dwarf (Sun-like) star at 10 pc. The panels from top to bottom show the S/N distribution for different configurations (X configurations) with baseline length ratios from 1:1 to 1:6. The S/N threshold is set at 10 to define the effective observation region where S/N ≥ 10.When the baseline length is 1 : 1, the maximum S/N (shown in the top-left quadrant) is achieved near α : β = 2 : 1; specifically, at (89,44) mas.
Current usage metrics show cumulative count of Article Views (full-text article views including HTML views, PDF and ePub downloads, according to the available data) and Abstracts Views on Vision4Press platform.
Data correspond to usage on the plateform after 2015. The current usage metrics is available 48-96 hours after online publication and is updated daily on week days.
Initial download of the metrics may take a while.