Open Access
Fig. 5
Download original image
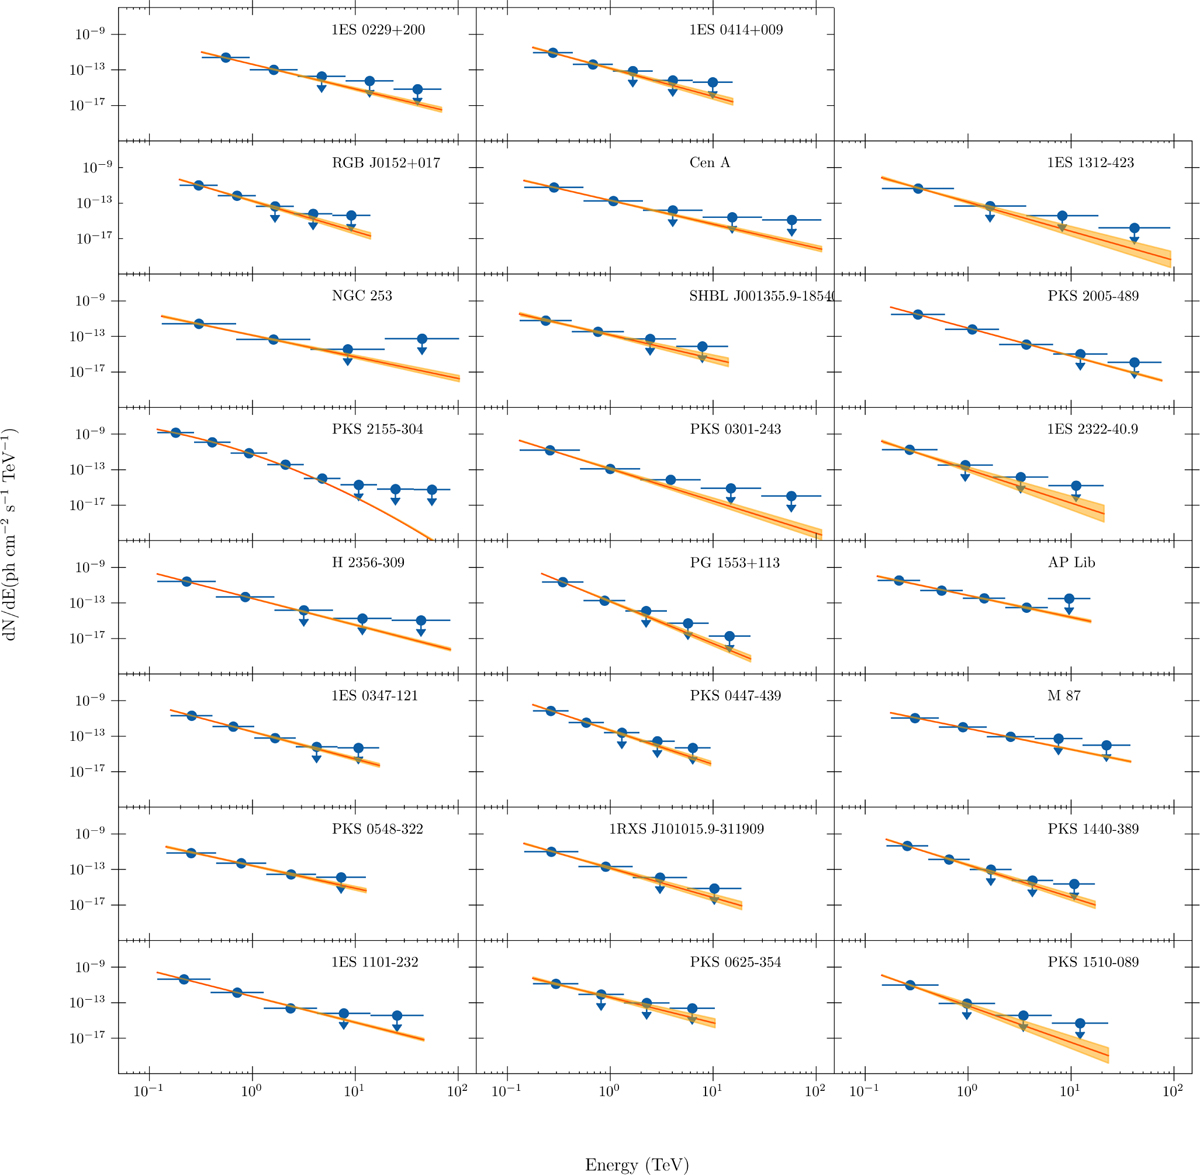
Spectra of the detected sources. The red line is the best fit model and the orange bands show the 1σ contours of the likelihood fit. No EBL correction has been applied. The blue points are derived as explained in the text, and the arrows represent the 95% CL upper limits.
Current usage metrics show cumulative count of Article Views (full-text article views including HTML views, PDF and ePub downloads, according to the available data) and Abstracts Views on Vision4Press platform.
Data correspond to usage on the plateform after 2015. The current usage metrics is available 48-96 hours after online publication and is updated daily on week days.
Initial download of the metrics may take a while.