Fig. 4
Download original image
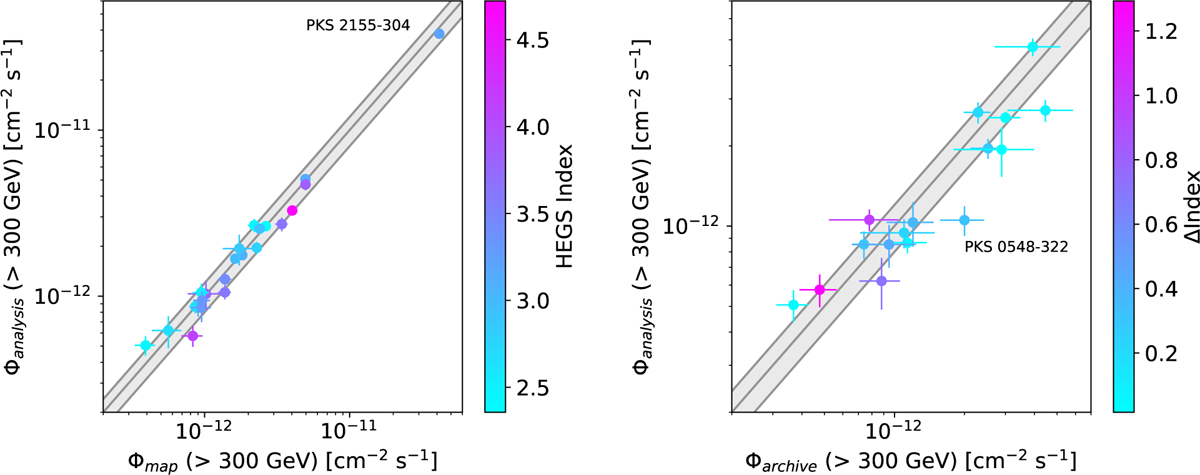
Comparison of the HEGS catalogue results with results from the HEGS maps and results from earlier publications. Left: integral flux above 300 GeV obtained with the HEGS maps (with a spectral index fixed to 3) compared to the integral flux above 300 GeV determined in the dedicated analysis. The colour indicates the spectral index value obtained in the dedicated analysis. Right: integral flux above 300 GeV obtained with the HEGS analysis compared to the integral flux above 300 GeV provided in earlier publications (see list in Table 1), removing the sources found to be variable (see list in Table 6). The colour indicates the absolute difference in spectral index values from the HEGS catalogue and those from archival publications. The point on the right top corner of the left plot is PKS 2155-304 and has been marked for the reader as well as PKS 0548-322 on the right plot. The grey area represents the 20% systematic uncertainties estimated by H.E.S.S.
Current usage metrics show cumulative count of Article Views (full-text article views including HTML views, PDF and ePub downloads, according to the available data) and Abstracts Views on Vision4Press platform.
Data correspond to usage on the plateform after 2015. The current usage metrics is available 48-96 hours after online publication and is updated daily on week days.
Initial download of the metrics may take a while.