Open Access
Fig. 3
Download original image
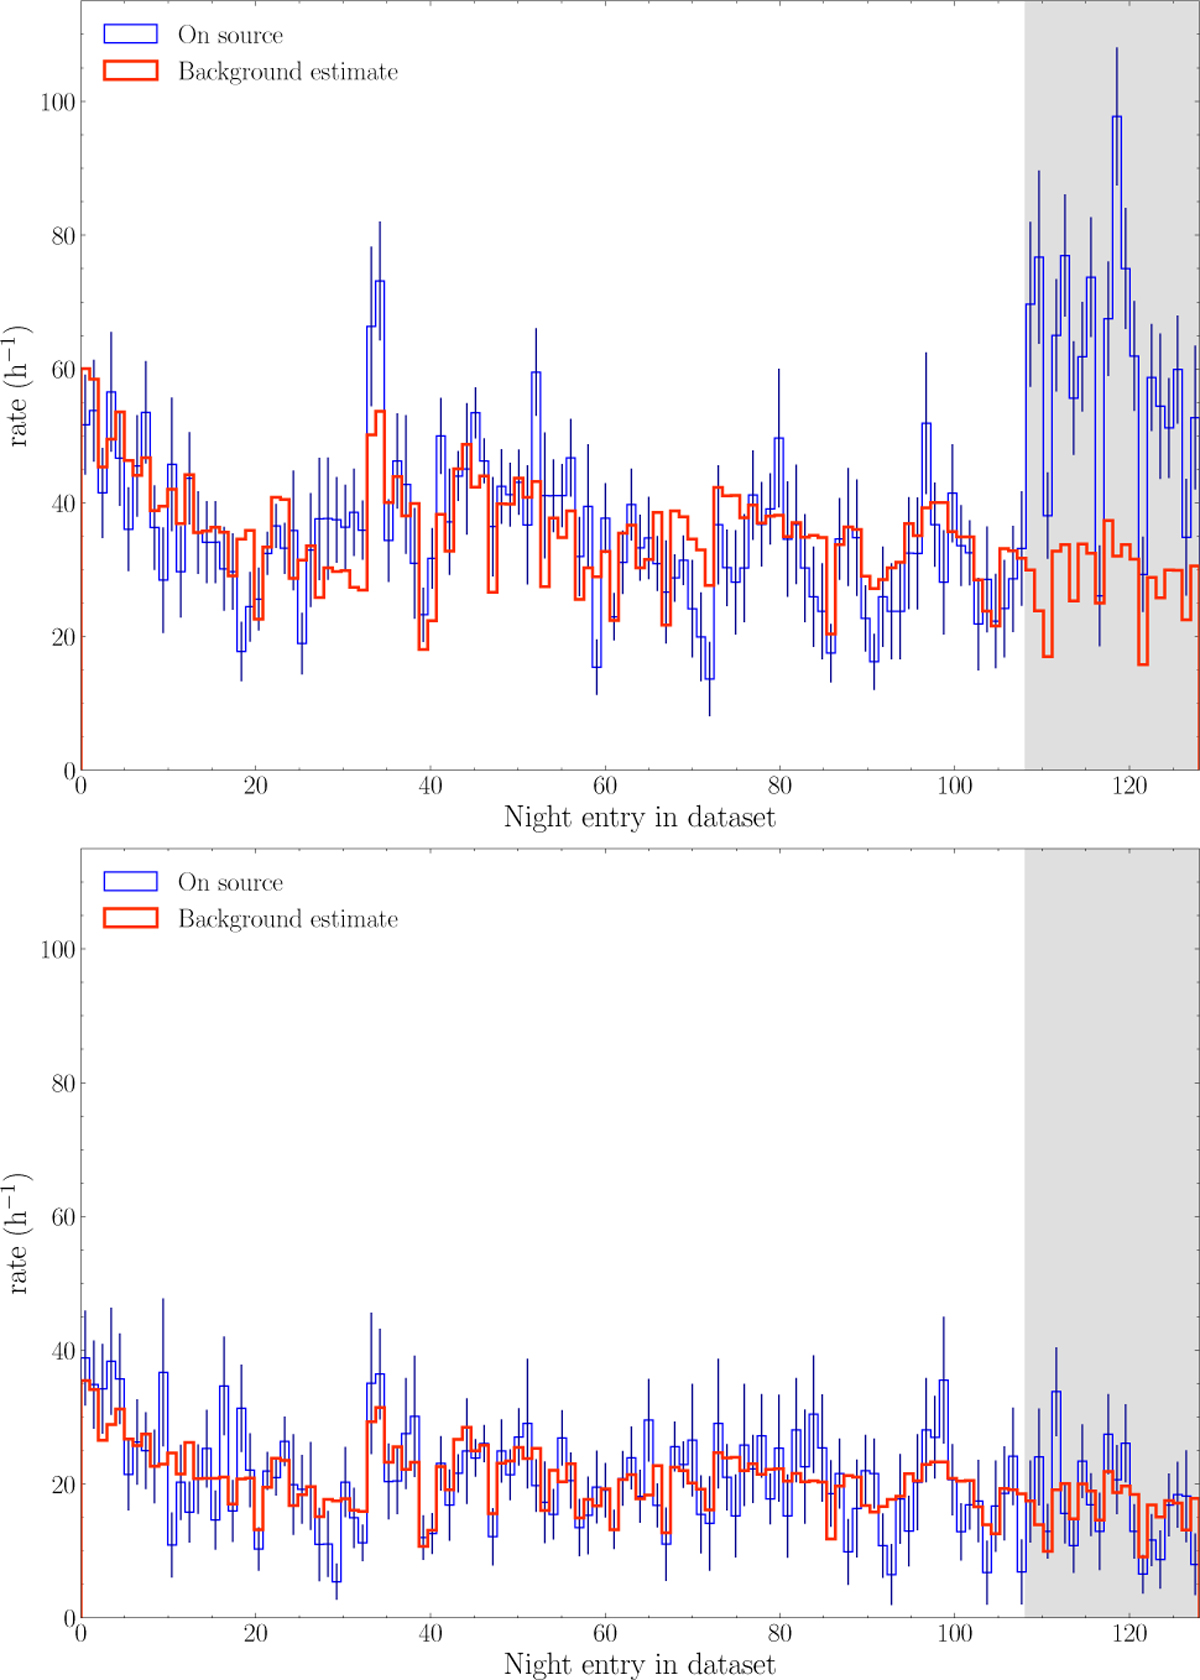
Temporal distribution of the ON counts (blue) and the estimated background (red) for the observation of PKS 2005-489 (top panel) and a point 1 degree away (lower panel), as a function of the night number. The grey area is the time window when the source was significantly active.
Current usage metrics show cumulative count of Article Views (full-text article views including HTML views, PDF and ePub downloads, according to the available data) and Abstracts Views on Vision4Press platform.
Data correspond to usage on the plateform after 2015. The current usage metrics is available 48-96 hours after online publication and is updated daily on week days.
Initial download of the metrics may take a while.