Fig. 13
Download original image
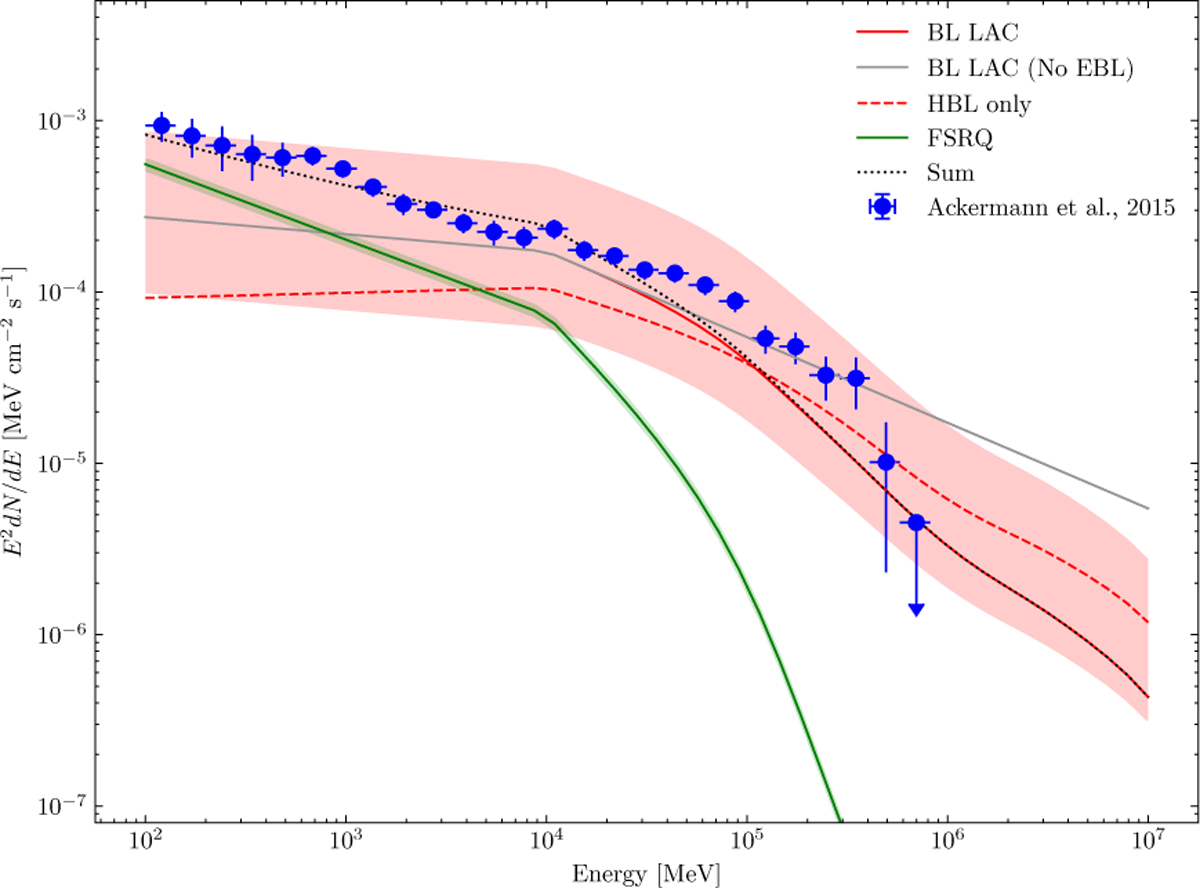
EGB measured by Fermi-LAT (blue points). The grey line is the contribution of the BL Lac objects and red line is the same but with a spectral break ΔΓ = 0.4. The green line is the contribution of FSRQ to the EGB. The red and green areas are the uncertainties for BL Lac objects and FSRQ, respectively, obtained by only taking the normalisation of the luminosity function into account. The dashed red line was computed using the luminosity function of HBL only derived by Ajello et al. (2014).
Current usage metrics show cumulative count of Article Views (full-text article views including HTML views, PDF and ePub downloads, according to the available data) and Abstracts Views on Vision4Press platform.
Data correspond to usage on the plateform after 2015. The current usage metrics is available 48-96 hours after online publication and is updated daily on week days.
Initial download of the metrics may take a while.