Fig. 11
Download original image
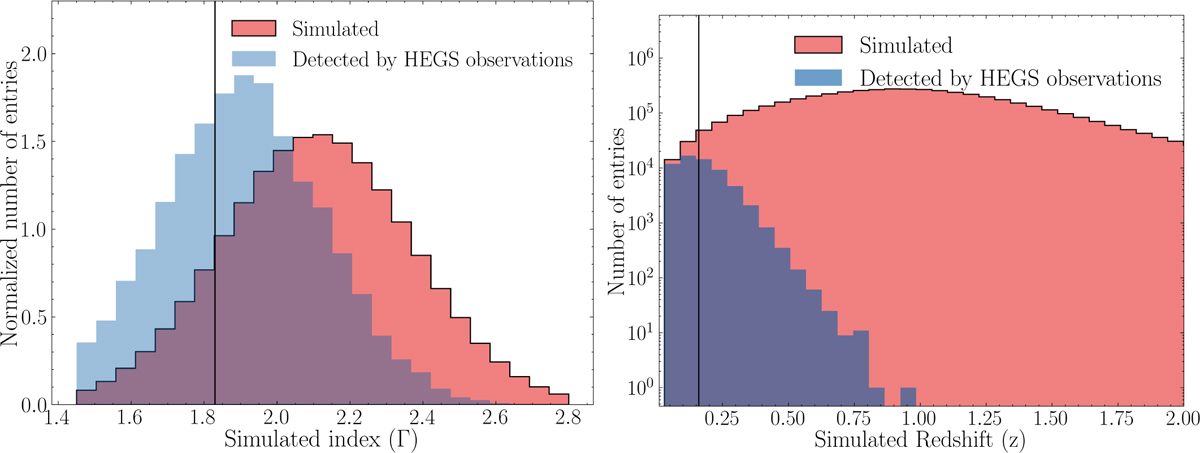
Simulated distribution of spectral index and redshift. Left: distribution of the spectral indices of simulated BL Lac sources (red), along with simulated BL Lac that would have been detected with the HEGS observation (blue). For visibility purposes, both distribution are normalised to have a density of 1. Right: distribution of the redshift for all simulated BL Lac sources (red) and for the BL Lac expected to be detected (blue). In both graphics, the black line corresponds to the actual mean of the population of BL Lac objects.
Current usage metrics show cumulative count of Article Views (full-text article views including HTML views, PDF and ePub downloads, according to the available data) and Abstracts Views on Vision4Press platform.
Data correspond to usage on the plateform after 2015. The current usage metrics is available 48-96 hours after online publication and is updated daily on week days.
Initial download of the metrics may take a while.