Fig. 10
Download original image
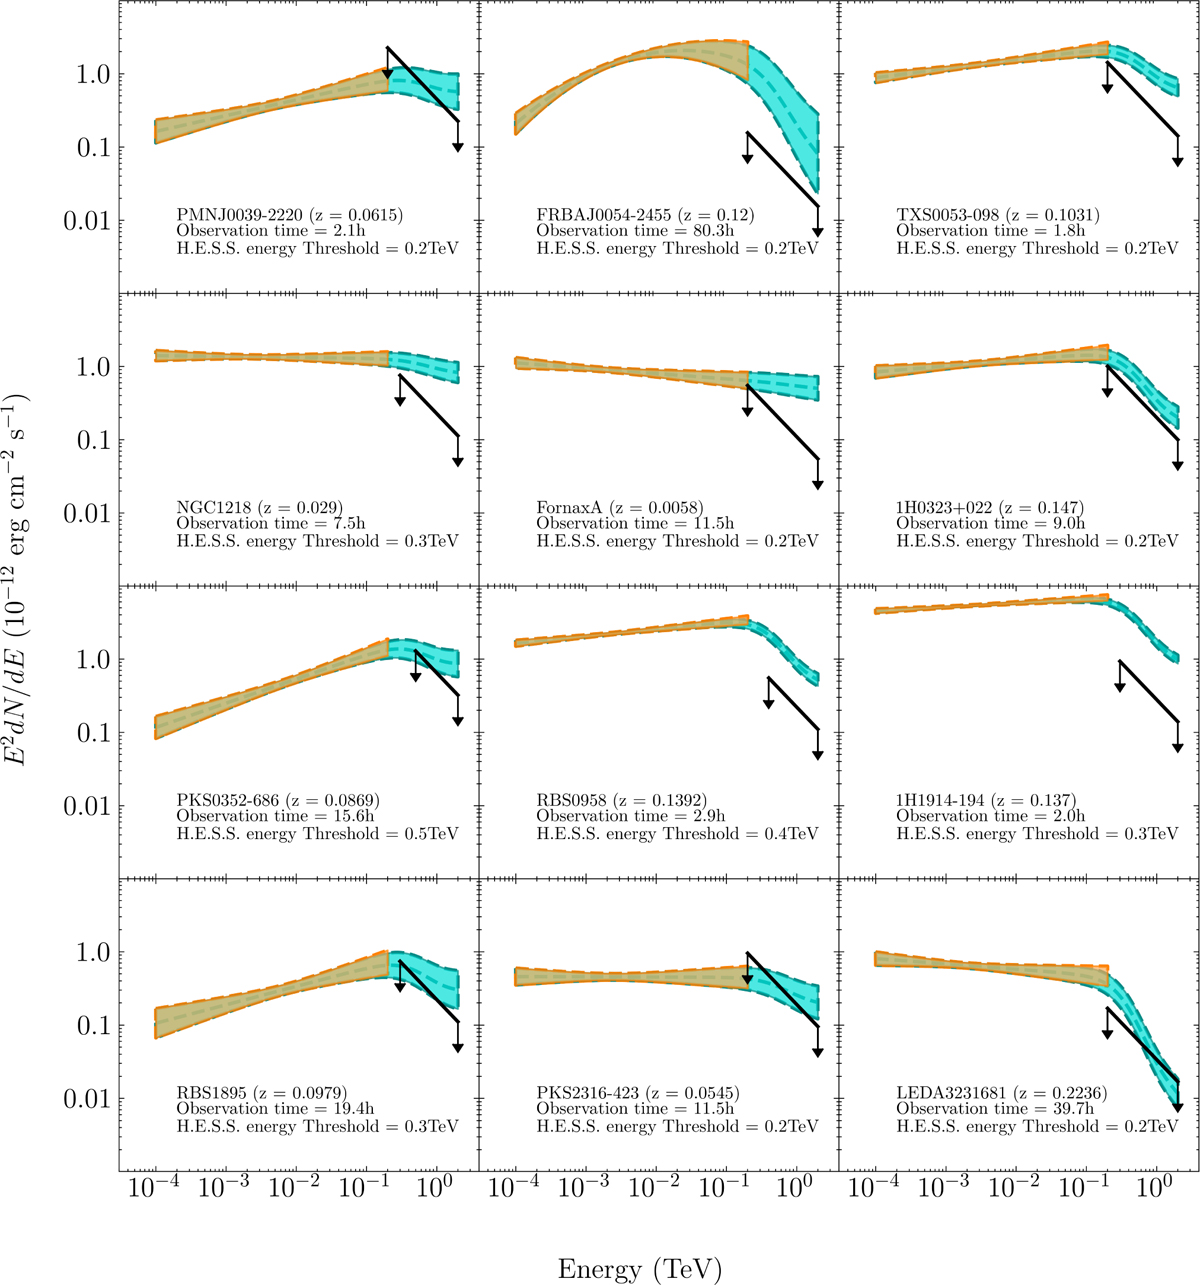
Spectral energy distributions of the 12 sources constrained by the observations presented in this work. The orange butterfly represents the Fermi-LAT measurement (from the 4FGL), and the cyan one indicates the extrapolation towards the energies observable by H.E.S.S. including EBL absorption. The black line represents the observed H.E.S.S. upper limit at 95% CL assuming an index of 3.
Current usage metrics show cumulative count of Article Views (full-text article views including HTML views, PDF and ePub downloads, according to the available data) and Abstracts Views on Vision4Press platform.
Data correspond to usage on the plateform after 2015. The current usage metrics is available 48-96 hours after online publication and is updated daily on week days.
Initial download of the metrics may take a while.