Fig. 1
Download original image
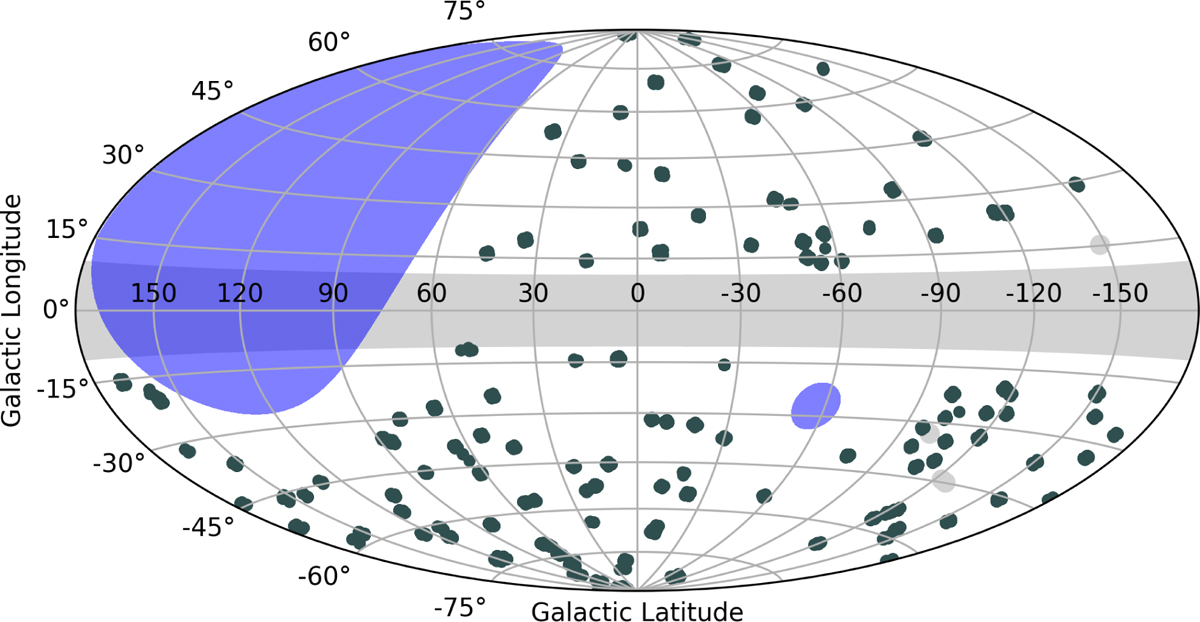
Hammer–Aitoff sky map showing the HEGS clusters (dark green areas). The central grey band shows the regions with |b| < 10° that are discarded in this work. The other grey areas show the rest of discarded regions (see text). The blue areas denote the part of the sky not observable by H.E.S.S., due to the zenith angles for observing these regions being above 60°.
Current usage metrics show cumulative count of Article Views (full-text article views including HTML views, PDF and ePub downloads, according to the available data) and Abstracts Views on Vision4Press platform.
Data correspond to usage on the plateform after 2015. The current usage metrics is available 48-96 hours after online publication and is updated daily on week days.
Initial download of the metrics may take a while.