Fig. 4.
Download original image
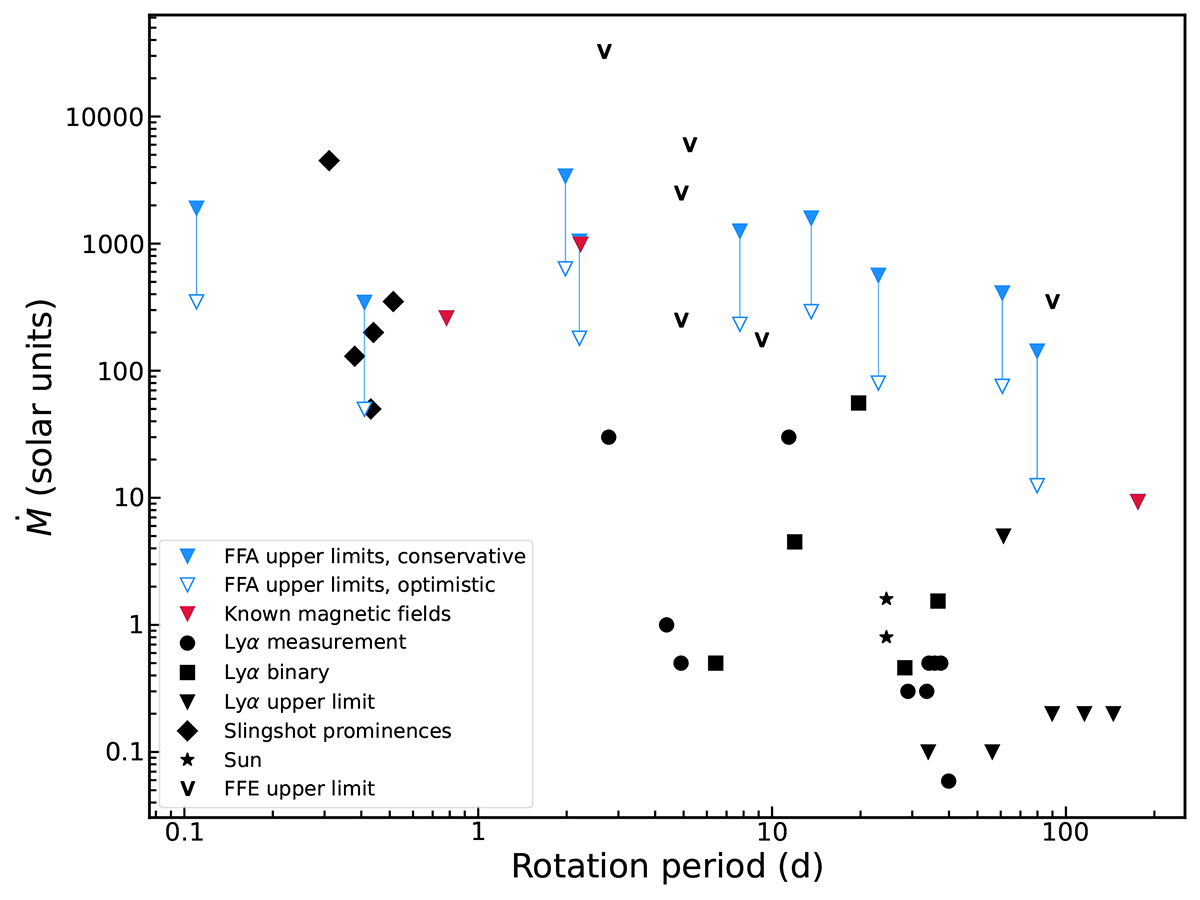
Mass-loss rate as a function of rotation period. The filled and unfilled blue triangles show the upper limits on the mass-loss rate we find in this work for the stars with no magnetic field measurements, using respectively high and mean estimates for the magnetic field. The filled red triangles represent the stars for which the large-scale magnetic field is known. The black symbols show the same mass-loss rate measurements and estimates as Fig. 2 from Lim & White (1996), Lim et al. (1996), Gaidos et al. (2000), Wood et al. (2001, 2002, 2005, 2014), Wood & Linsky (2010), Wood (2018), Jardine & Collier Cameron (2019), and Finley et al. (2019). No error bars are plotted for the stellar literature values as the uncertainties are not reported in the corresponding papers.
Current usage metrics show cumulative count of Article Views (full-text article views including HTML views, PDF and ePub downloads, according to the available data) and Abstracts Views on Vision4Press platform.
Data correspond to usage on the plateform after 2015. The current usage metrics is available 48-96 hours after online publication and is updated daily on week days.
Initial download of the metrics may take a while.