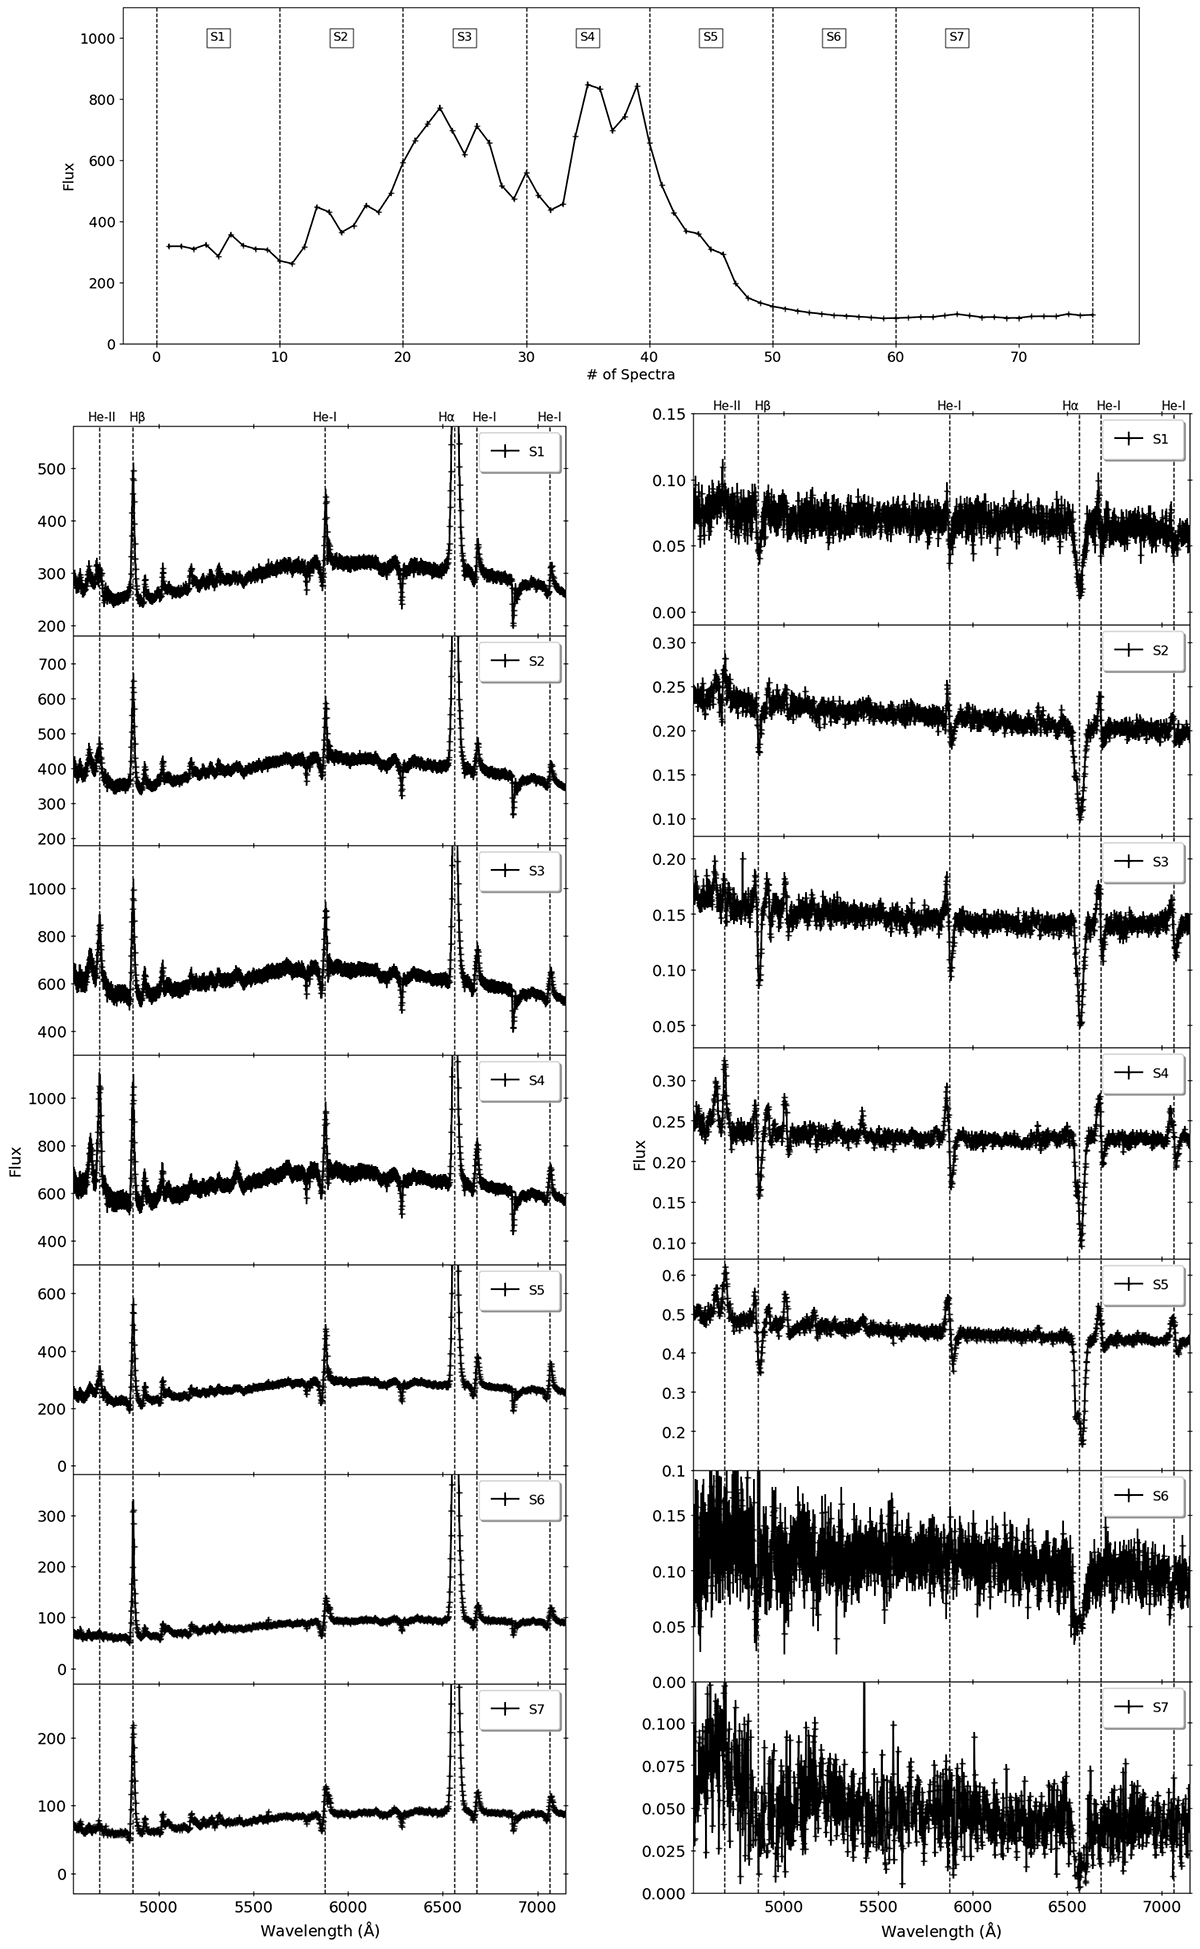
Fig. 3.
Download original image
Shorter-term evolution throughout day 2. The top panel shows the day 2 light curve and the intervals selected for calculating short-term rms spectra. The flux spectra for each segment are shown in the left column, with the corresponding rms spectra in the right panels. Dotted vertical lines mark the positions of the He I lines (at ∼5876, 6678, and 7065 Å), He II 4686 Å, Hα, and Hβ. Interestingly, the He II line shows significant flux variations between S3 and S5, coinciding with the strongest inverted profiles in the rms spectra.
Current usage metrics show cumulative count of Article Views (full-text article views including HTML views, PDF and ePub downloads, according to the available data) and Abstracts Views on Vision4Press platform.
Data correspond to usage on the plateform after 2015. The current usage metrics is available 48-96 hours after online publication and is updated daily on week days.
Initial download of the metrics may take a while.