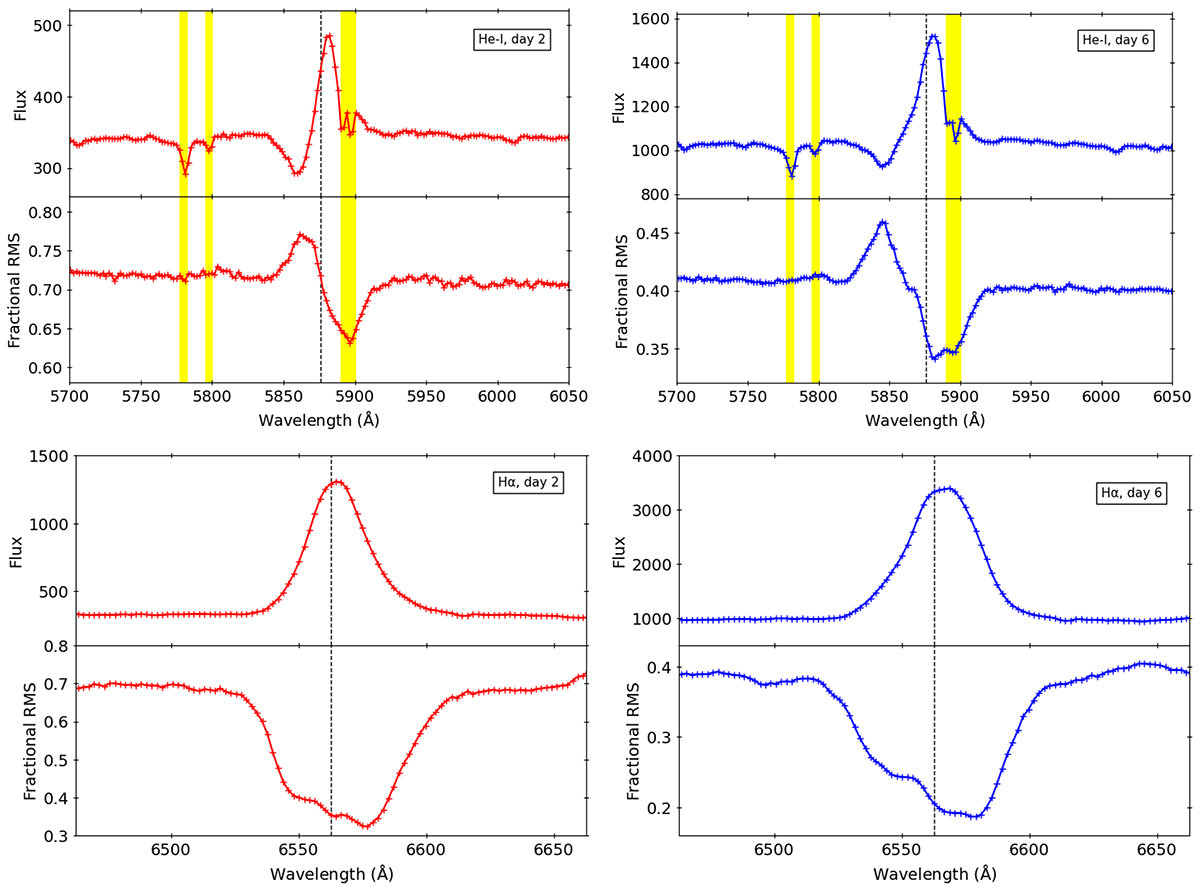
Fig. 2.
Download original image
Detailed rms and flux spectra from day 2 and day 6. The four panels show the flux (top) and fractional rms (bottom) spectra for day 2 (left) and day 6 (right). The top row presents the behaviour of He I-5876, while Hα is shown in the bottom row. The rms spectra show an inverted shape compared to the flux spectra, especially in the presence of P-Cygni profiles. Statistical errors are smaller than the data points. Vertical dashed lines indicate the laboratory wavelength of the corresponding transition. Light yellow boxes highlight the regions affected by interstellar bands.
Current usage metrics show cumulative count of Article Views (full-text article views including HTML views, PDF and ePub downloads, according to the available data) and Abstracts Views on Vision4Press platform.
Data correspond to usage on the plateform after 2015. The current usage metrics is available 48-96 hours after online publication and is updated daily on week days.
Initial download of the metrics may take a while.