Fig. C.6
Download original image
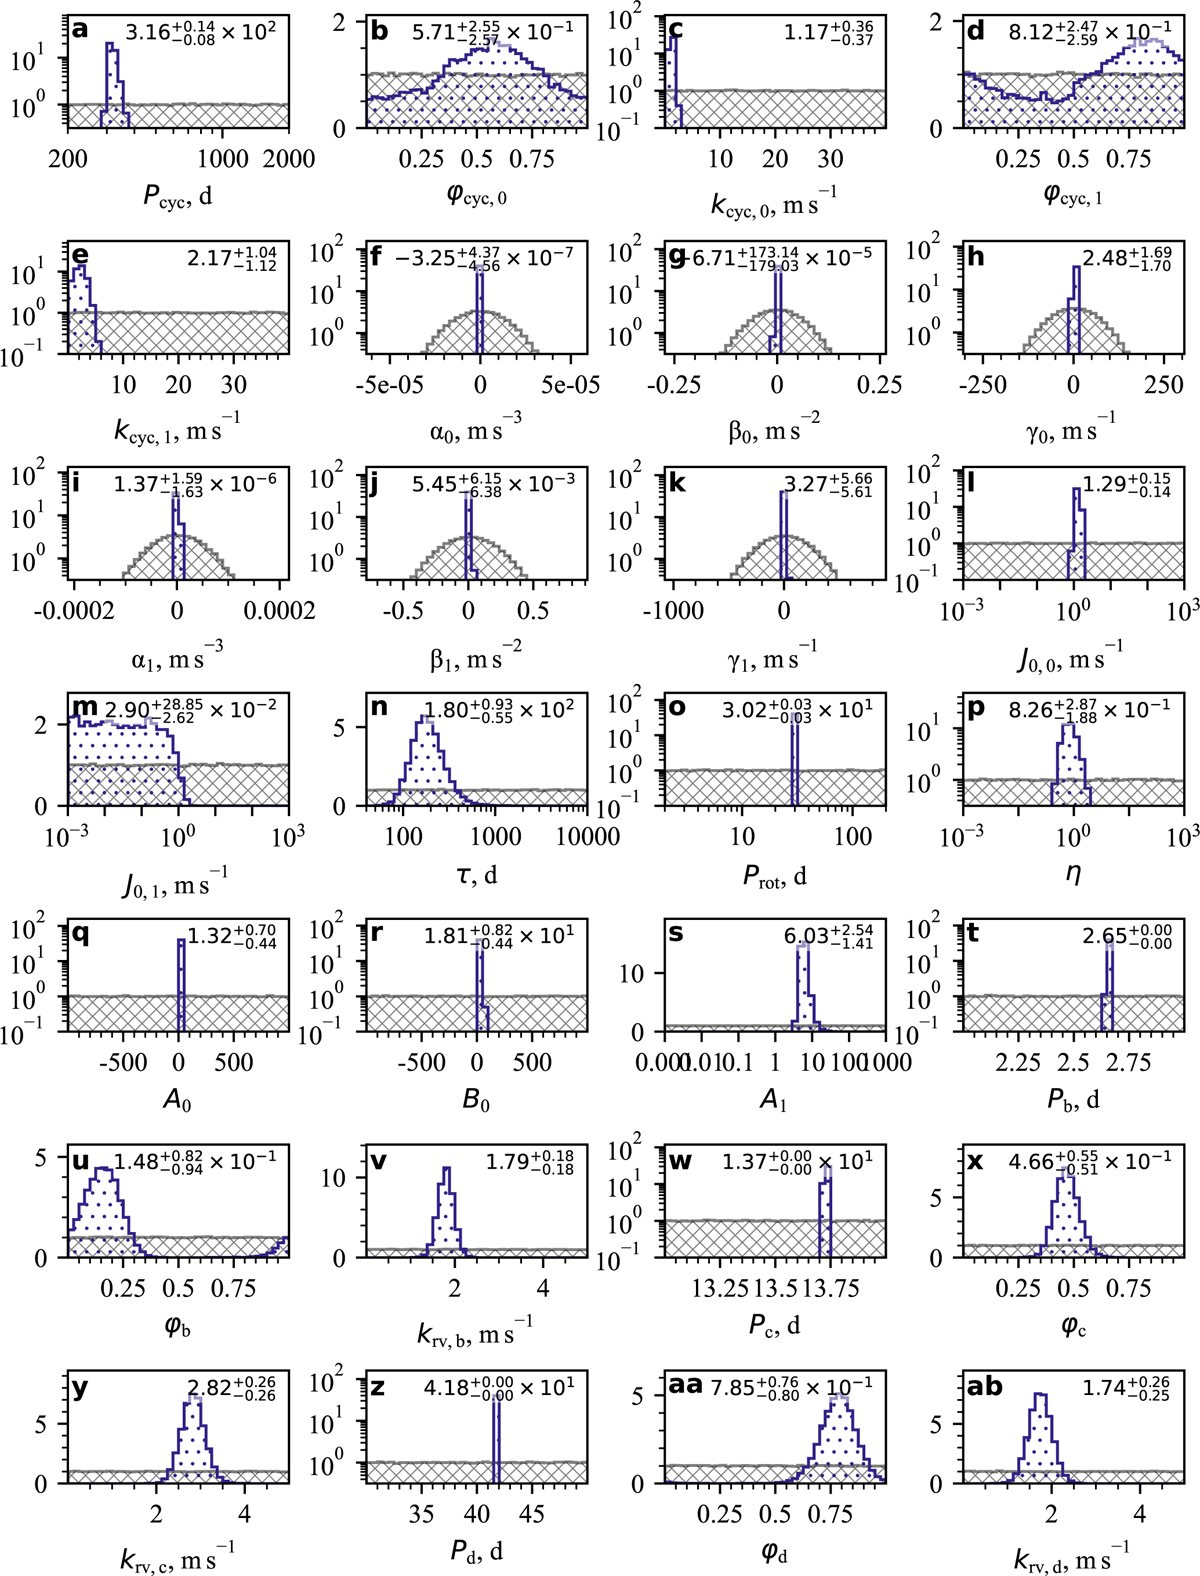
Visual extension of Table C.6: prior (grey, cross-hatched) and posterior (blue, dot-hatched) distributions of all parameters in our best model (d4). Uncertainties in our posteriors reflect the 16th and the 84th percentiles. For the sake of brevity, we show three significant digits for posterior medians, and truncate uncertainties to match the same precision.
Current usage metrics show cumulative count of Article Views (full-text article views including HTML views, PDF and ePub downloads, according to the available data) and Abstracts Views on Vision4Press platform.
Data correspond to usage on the plateform after 2015. The current usage metrics is available 48-96 hours after online publication and is updated daily on week days.
Initial download of the metrics may take a while.