Fig. C.5
Download original image
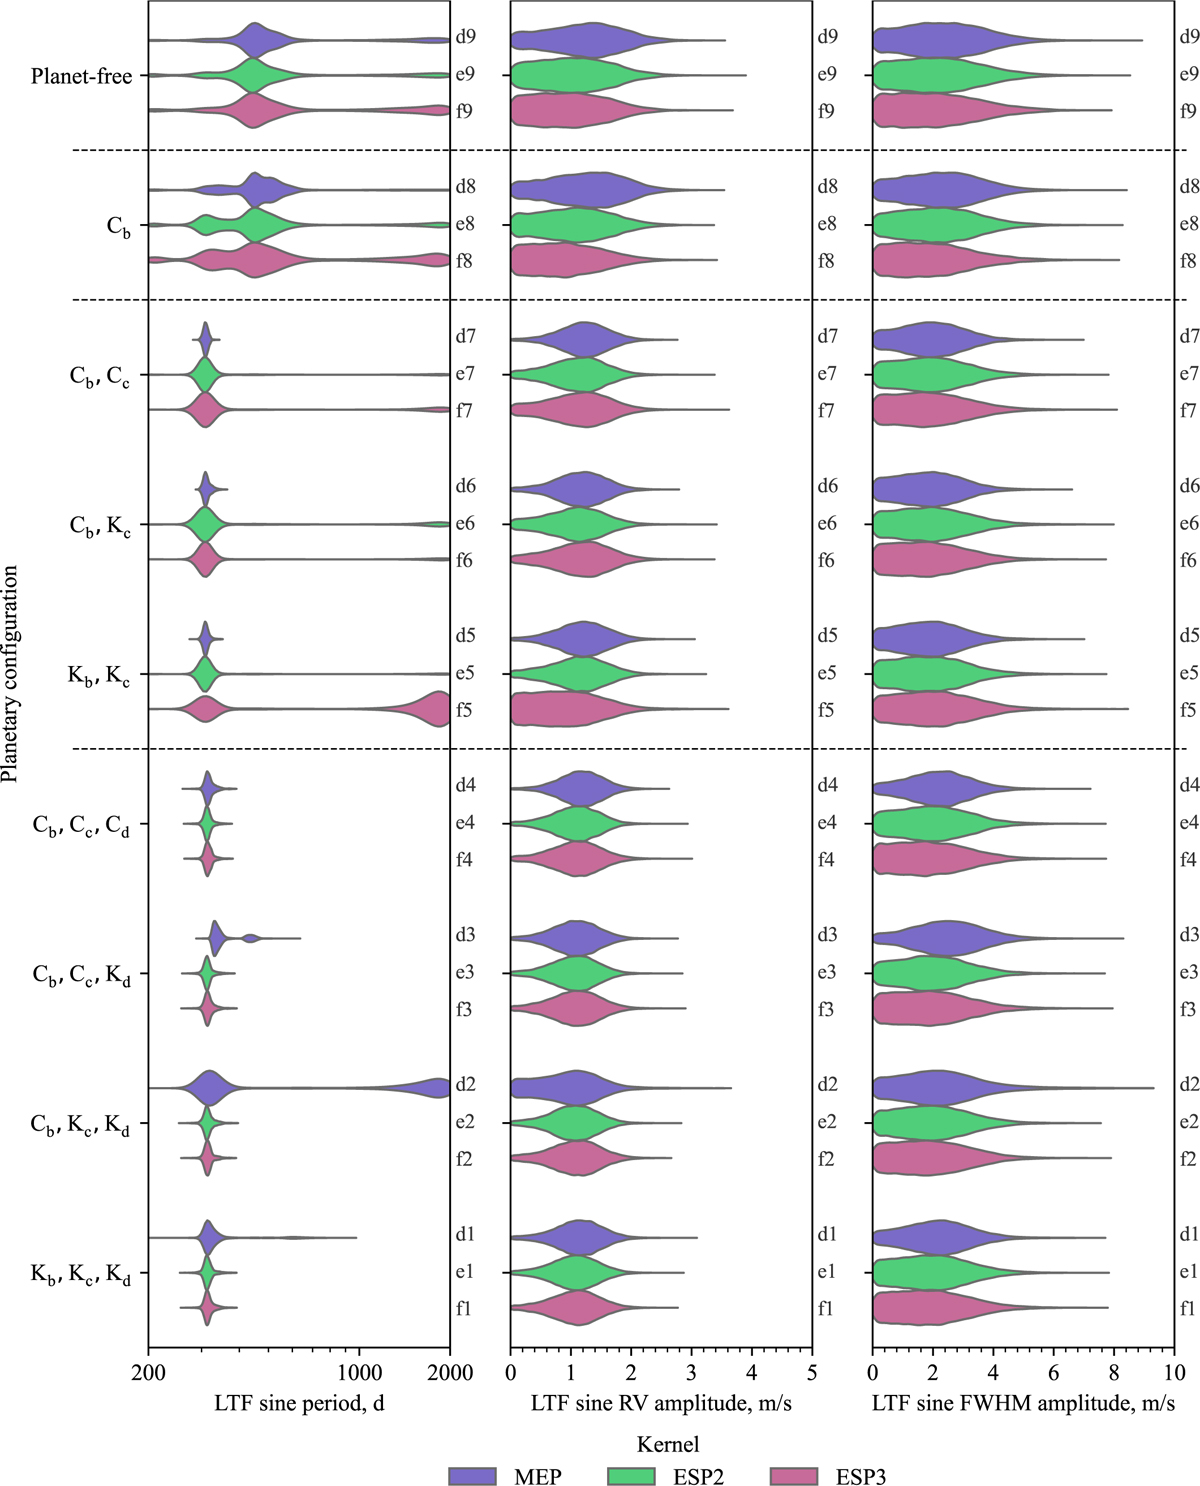
Violin plots of all models with a sine component in their TFs that show the posteriors of: (a) the cycle period Pcyc, (b) the RV amplitude kcyc, 0, (c) the RV amplitude kcyc, 0. Violin plots are arranged vertically by planetary configuration in the same order as in Fig. 4. Plots come in three colours: blue for MEP, green for ESP2 and red for ESP3. Every distribution is accompanied by its corresponding model label.
Current usage metrics show cumulative count of Article Views (full-text article views including HTML views, PDF and ePub downloads, according to the available data) and Abstracts Views on Vision4Press platform.
Data correspond to usage on the plateform after 2015. The current usage metrics is available 48-96 hours after online publication and is updated daily on week days.
Initial download of the metrics may take a while.