Open Access
Fig. C.4
Download original image
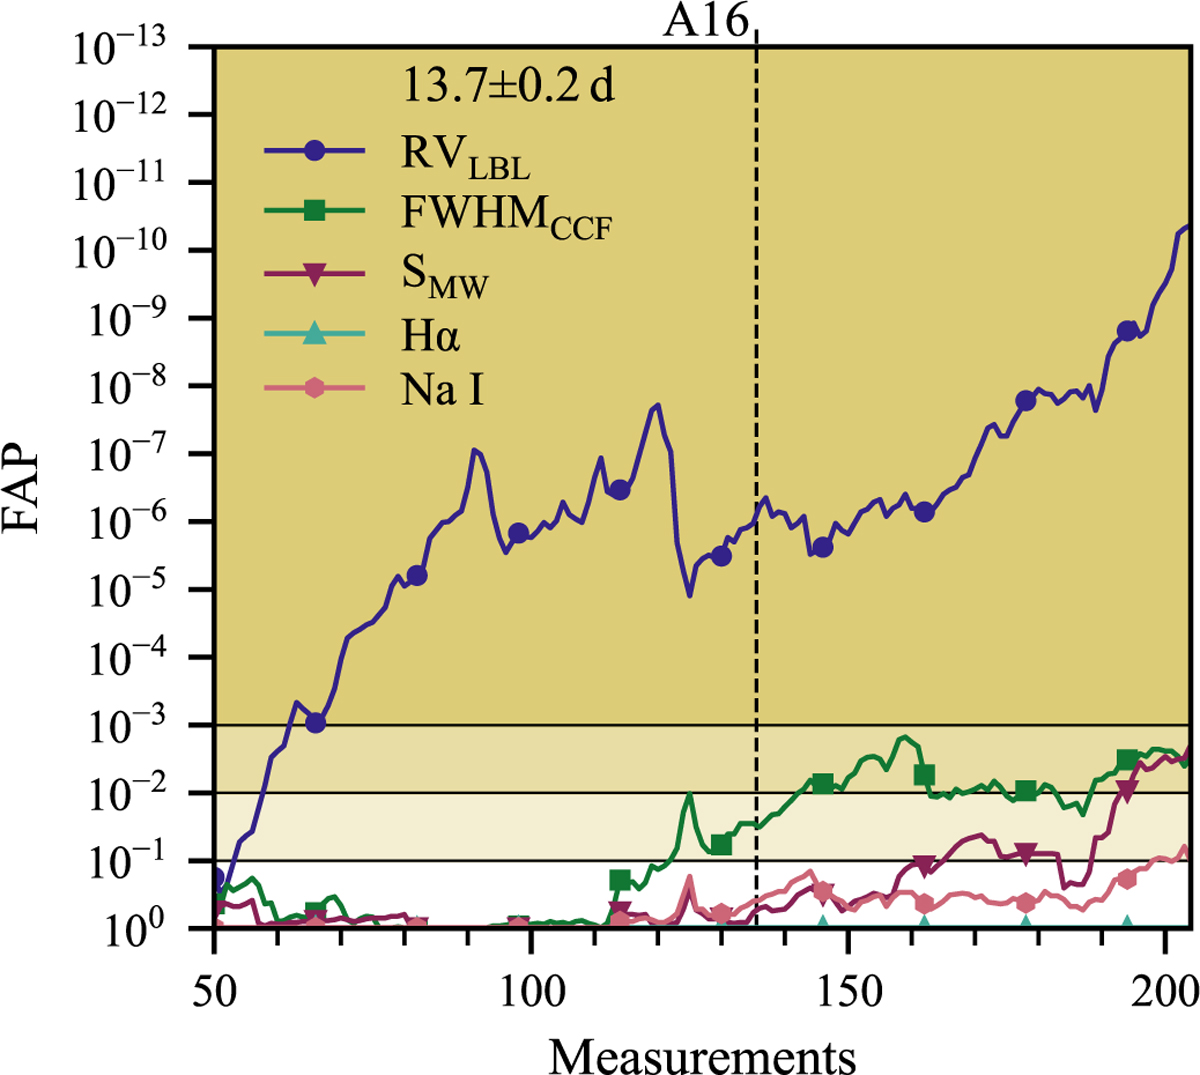
FAP evolution of the strongest peak within 0.2 d of the 13.7 d signal for long-term detrended: LBL RV (blue circles), CCF FWHM (green squares), S-index (downward red triangles), Hα (upward teal triangles) and Na I (pink hexagons). The temporal coverage of A16 is marked by a dashed black line.
Current usage metrics show cumulative count of Article Views (full-text article views including HTML views, PDF and ePub downloads, according to the available data) and Abstracts Views on Vision4Press platform.
Data correspond to usage on the plateform after 2015. The current usage metrics is available 48-96 hours after online publication and is updated daily on week days.
Initial download of the metrics may take a while.