Open Access
Fig. C.2
Download original image
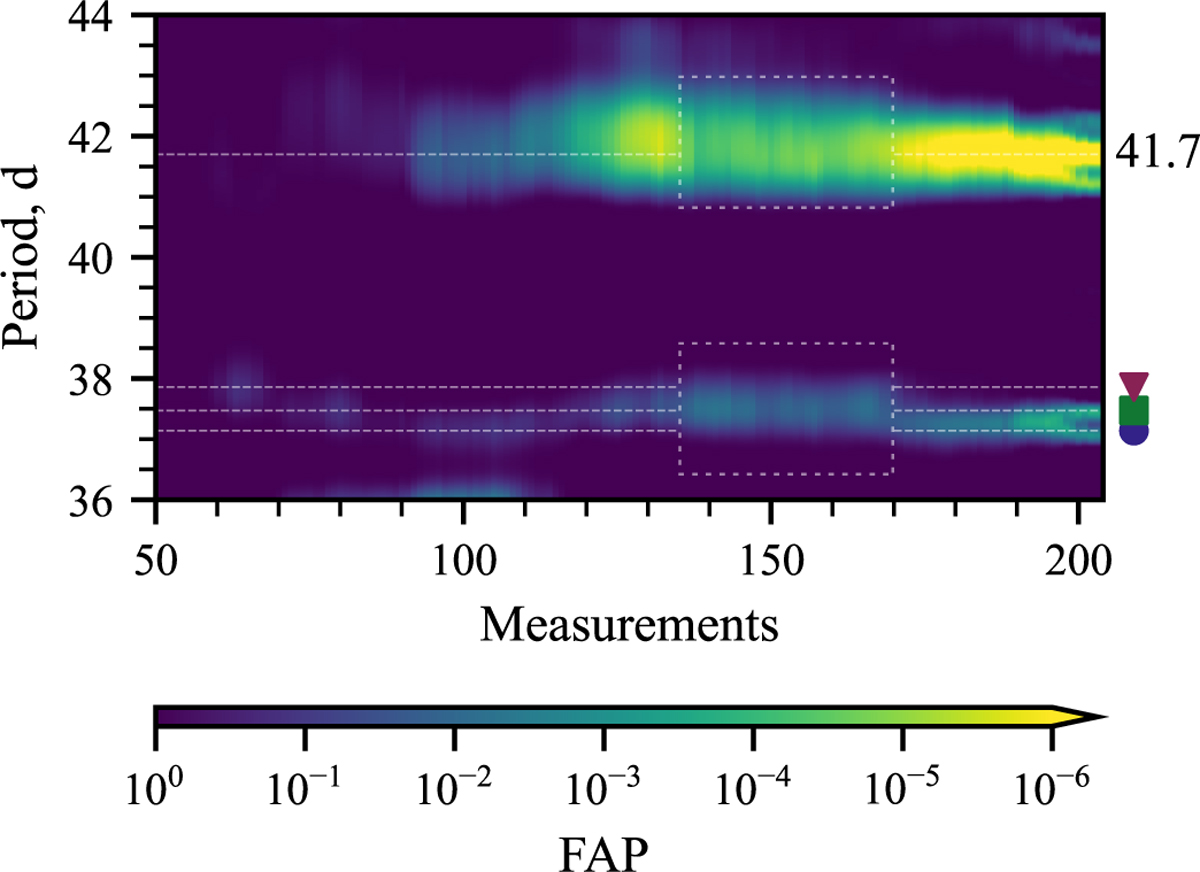
FAP evolution of long-term detrended RV signals between 36–44 d. We plot the location of the 41.7 d signal and its aliases within the interval. Alias symbols match Fig. B.1e, Fig. B.2k and Fig. 2c. Dashed white rectangles display the power transfer from the 41.7 d signal to its 37–38 d alias family.
Current usage metrics show cumulative count of Article Views (full-text article views including HTML views, PDF and ePub downloads, according to the available data) and Abstracts Views on Vision4Press platform.
Data correspond to usage on the plateform after 2015. The current usage metrics is available 48-96 hours after online publication and is updated daily on week days.
Initial download of the metrics may take a while.