Fig. 3.
Download original image
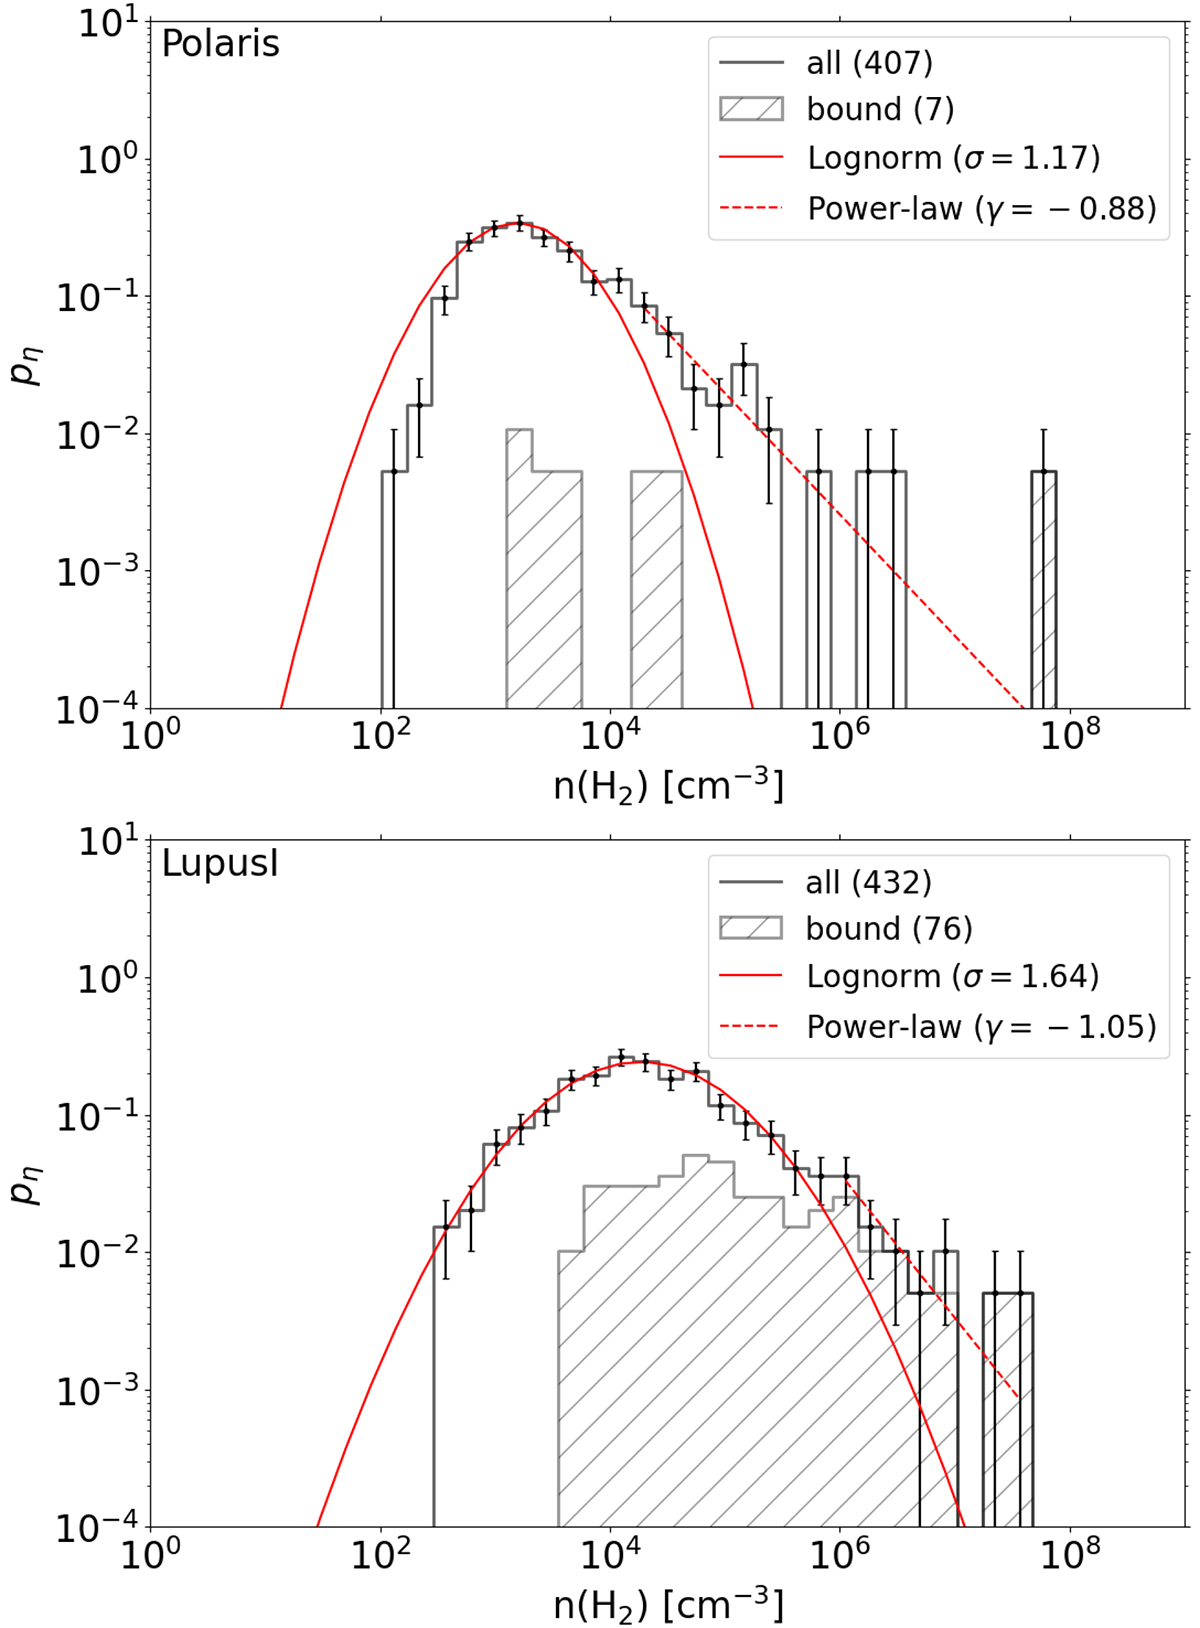
Histograms of mean volume density of identified core for Polaris (top) and Lupus I (bottom). The white and diagonal bins represent the sample of all cores and only bound cores, respectively. The solid red curves and dotted red line indicate the results of the log-normal fit and power-law fit. The error bar was calculated by Poisson statistics.
Current usage metrics show cumulative count of Article Views (full-text article views including HTML views, PDF and ePub downloads, according to the available data) and Abstracts Views on Vision4Press platform.
Data correspond to usage on the plateform after 2015. The current usage metrics is available 48-96 hours after online publication and is updated daily on week days.
Initial download of the metrics may take a while.