Open Access
Fig. D.2
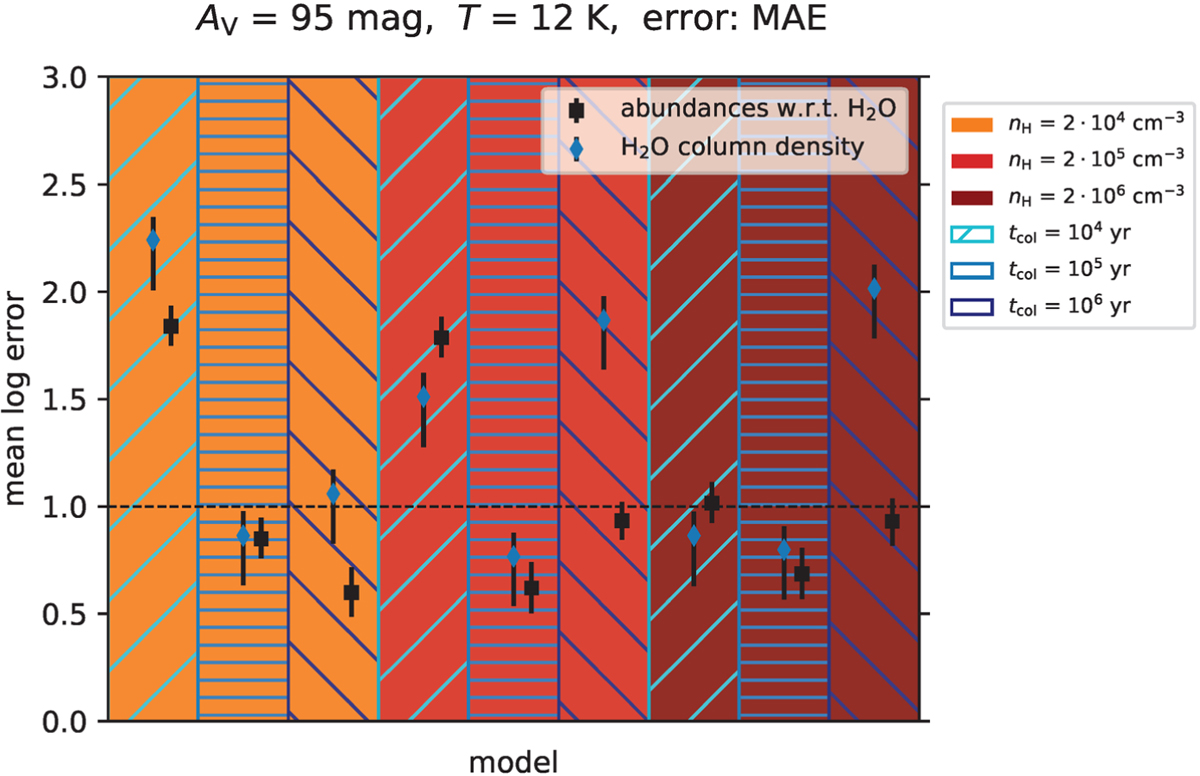
Download original image
Same as Fig. D.1, but for J110621 (AV = 95 mag). The two best models correspond to intermediate collapse times and intermediate/high final densities (second and fifth models from the right).
Current usage metrics show cumulative count of Article Views (full-text article views including HTML views, PDF and ePub downloads, according to the available data) and Abstracts Views on Vision4Press platform.
Data correspond to usage on the plateform after 2015. The current usage metrics is available 48-96 hours after online publication and is updated daily on week days.
Initial download of the metrics may take a while.