Open Access
Fig. 1
Download original image
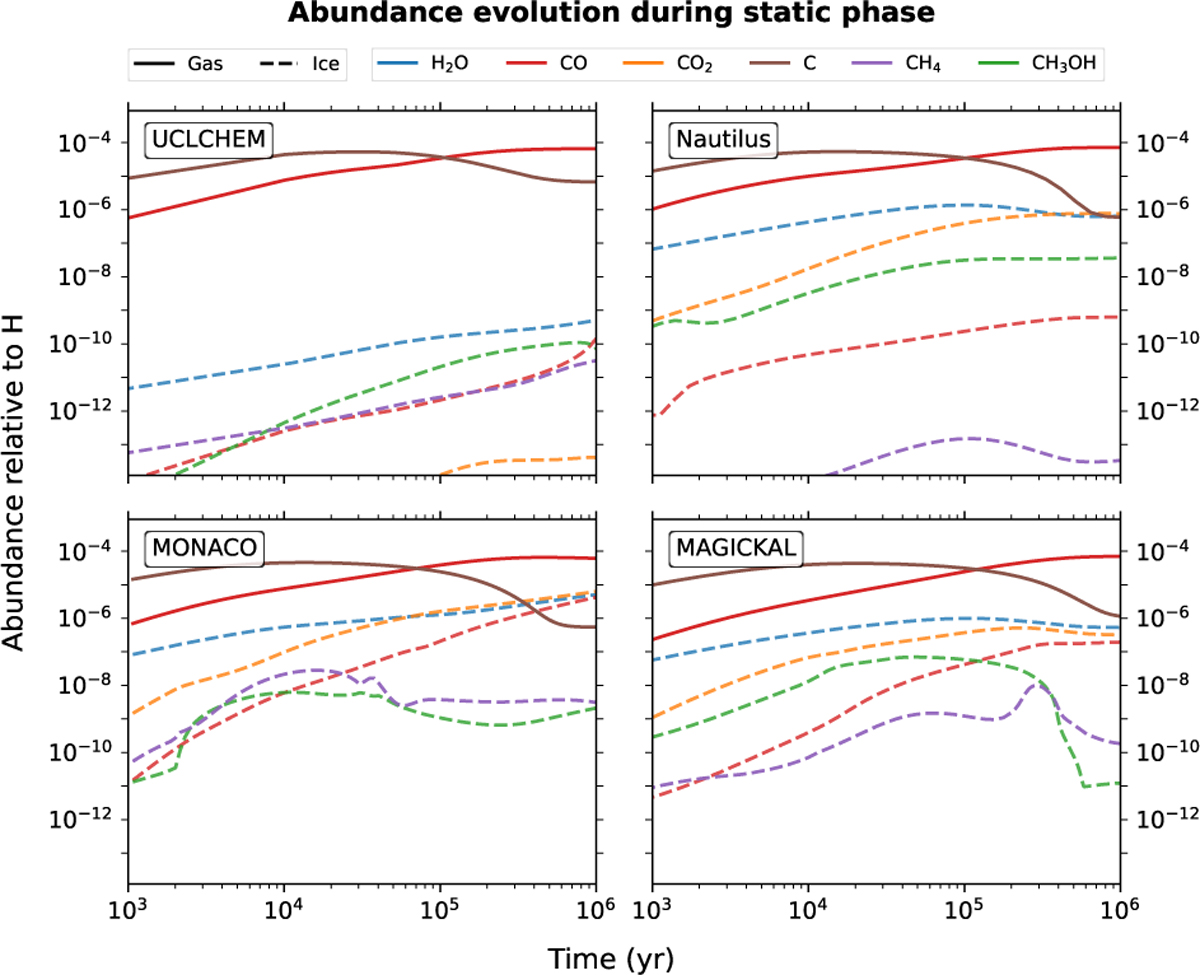
Time evolution of the gas and ice molecular abundances for most relevant species predicted by the different astrochemical codes for the phase 0 runs. The solid lines indicate gas-phase abundances, while the dashed lines show ice abundances. The colours indicate the different molecular species (see legend at top).
Current usage metrics show cumulative count of Article Views (full-text article views including HTML views, PDF and ePub downloads, according to the available data) and Abstracts Views on Vision4Press platform.
Data correspond to usage on the plateform after 2015. The current usage metrics is available 48-96 hours after online publication and is updated daily on week days.
Initial download of the metrics may take a while.