Fig. 6.
Download original image
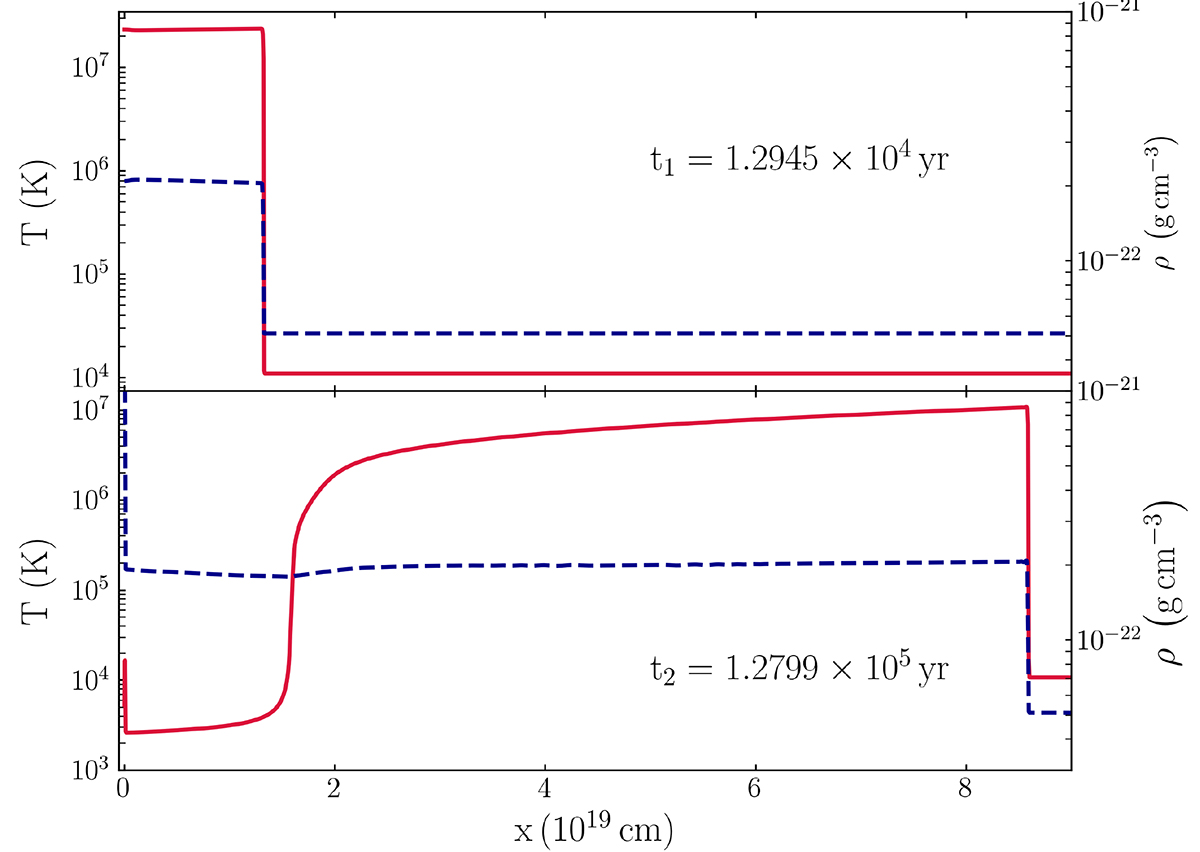
Illustration of the flow structure in pre-shock gas interacting with the shock front. The top panel exhibits temperature (red-solid curve) and density (blue-dashed curve) profiles at t1 = 1.2945 × 10⁴ years, while the bottom panel presents the same at a later time, t = 1.2799 × 10⁵ years, highlighting the interplay between Chianti cooling data and gas dynamics.
Current usage metrics show cumulative count of Article Views (full-text article views including HTML views, PDF and ePub downloads, according to the available data) and Abstracts Views on Vision4Press platform.
Data correspond to usage on the plateform after 2015. The current usage metrics is available 48-96 hours after online publication and is updated daily on week days.
Initial download of the metrics may take a while.