Open Access
Fig. 5.
Download original image
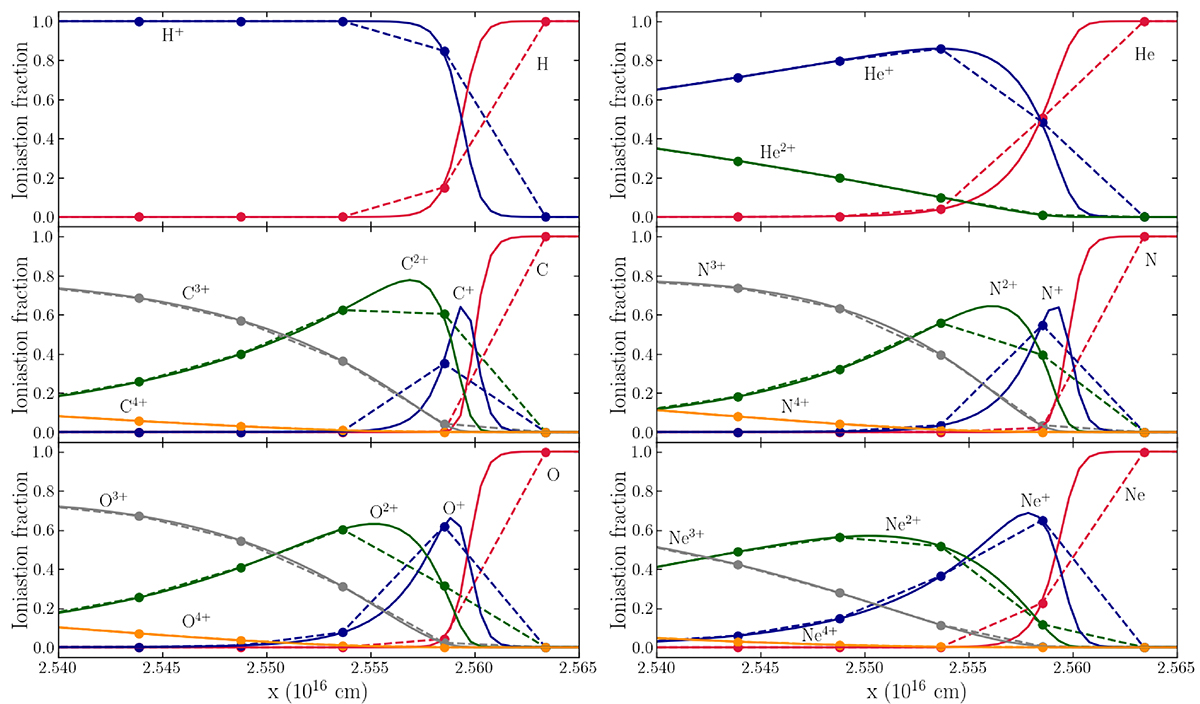
Spatial profiles of ion fractions for H, He, C, N, O, and Ne across the shock front for shock test 1, comparing the low (dashed lines) and high (solid lines) resolution simulations. The flow moves from right to left, with the shock positioned at the plot’s right-hand boundary. The plot depicts only the downstream region.
Current usage metrics show cumulative count of Article Views (full-text article views including HTML views, PDF and ePub downloads, according to the available data) and Abstracts Views on Vision4Press platform.
Data correspond to usage on the plateform after 2015. The current usage metrics is available 48-96 hours after online publication and is updated daily on week days.
Initial download of the metrics may take a while.