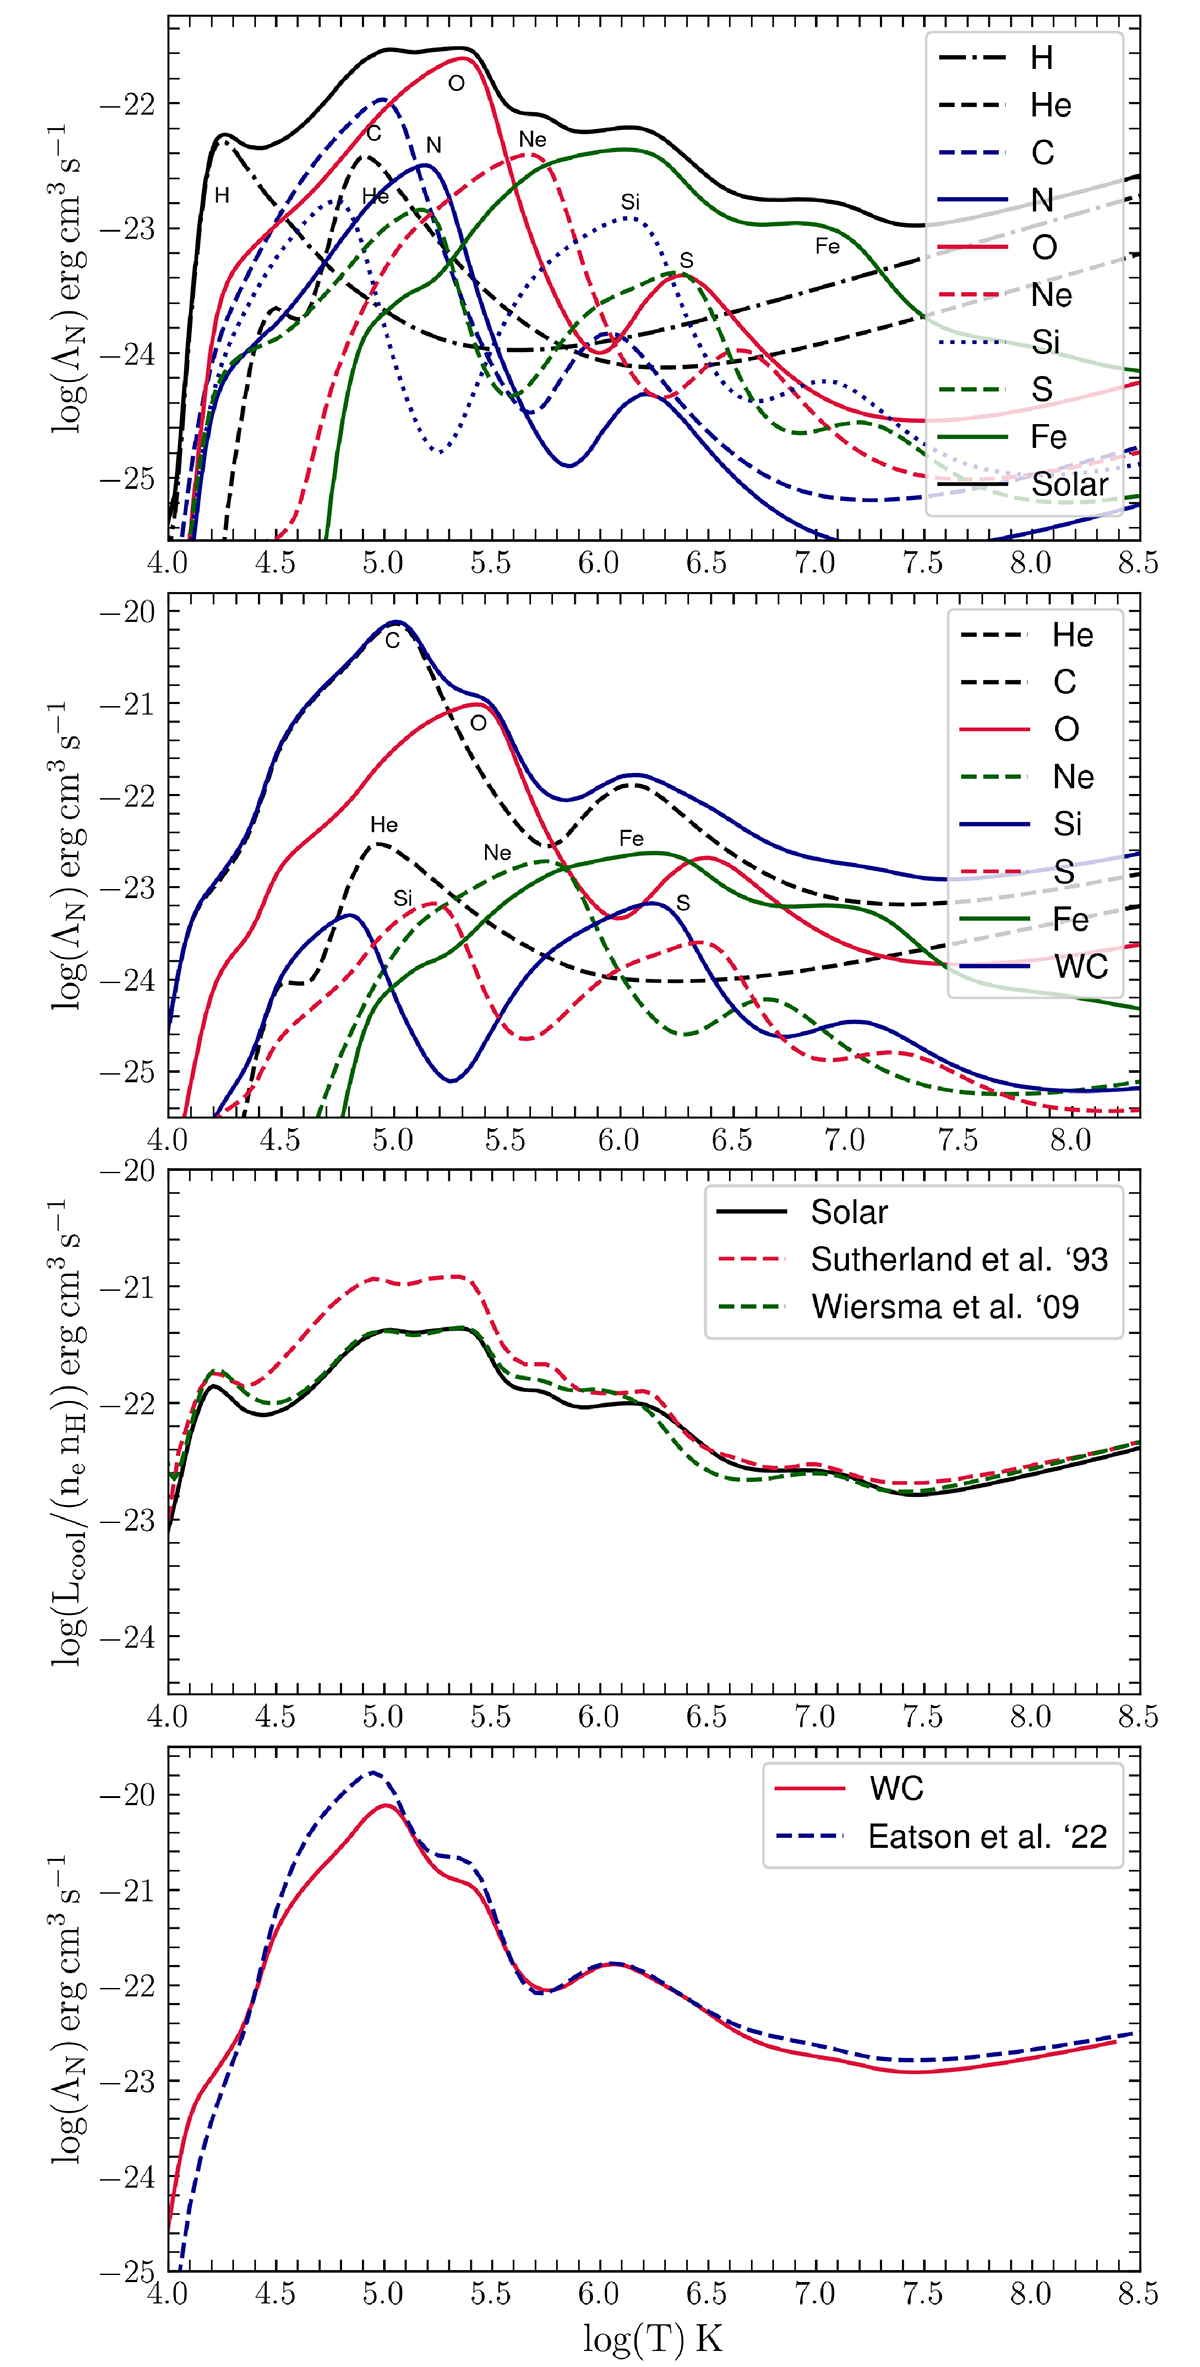
Fig. 2.
Download original image
Radiative cooling rates under CIE conditions obtained with our new microphysics module, including elemental contributions Lκ (scaled by (mH/ρ)2 in the first, second, and fourth panels, and by (nenH)−1 in the third panel, respectively) and net cooling function for Solar and WC abundances. Top: elemental contribution of the cooling curve for solar abundances, as specified in Table 2. The black solid line represents the net cooling curve. Second: elemental contribution of the cooling curve for WC abundances, as indicated in Table 2. The blue solid line represents the net cooling curve. Third: comparison of the net cooling curves for solar abundances with those derived by Sutherland & Dopita (1993) and Wiersma et al. (2009). Bottom: net cooling curves for WC abundances compared with the cooling function obtained by Eatson et al. (2022a).
Current usage metrics show cumulative count of Article Views (full-text article views including HTML views, PDF and ePub downloads, according to the available data) and Abstracts Views on Vision4Press platform.
Data correspond to usage on the plateform after 2015. The current usage metrics is available 48-96 hours after online publication and is updated daily on week days.
Initial download of the metrics may take a while.