Fig. 17.
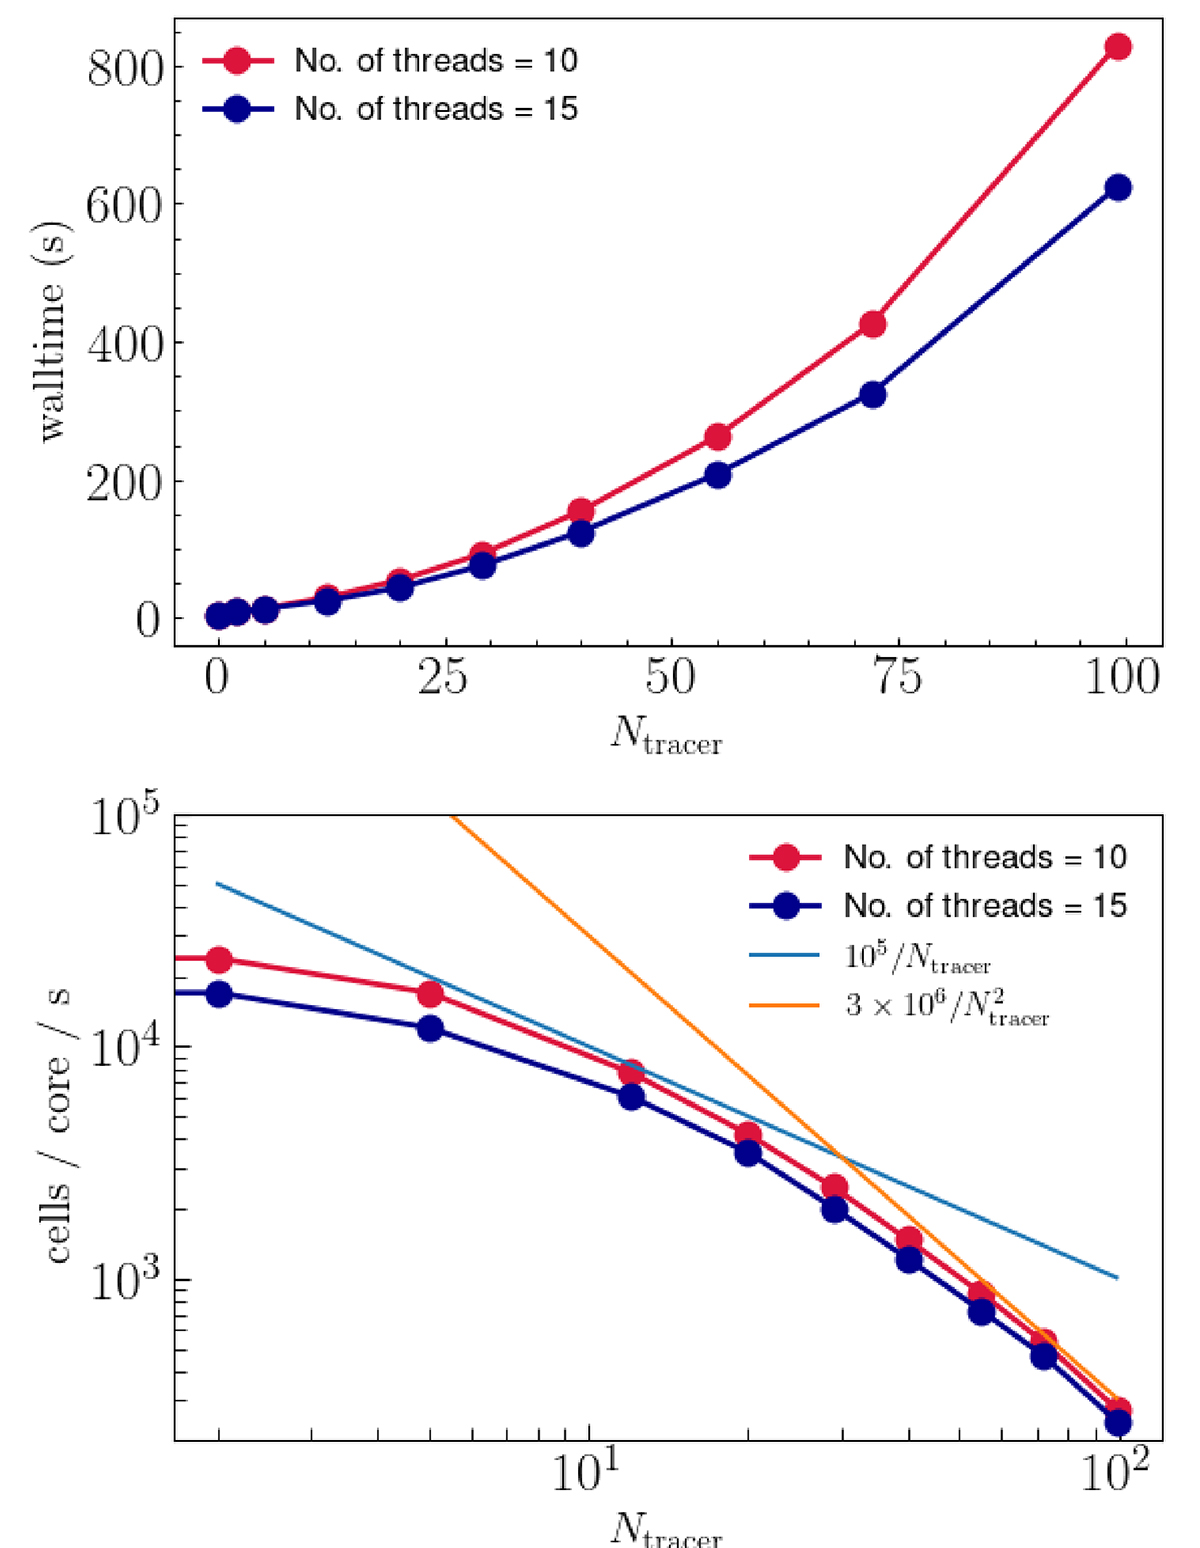
Download original image
Relation between simulation speed and the number of tracers (elements plus their ions). The upper plot shows the wall-time of a 1D simulation using from one to nine elements, with either 10 or 15 OpenMP threads on 10 or 15 cores. The lower panel shows the same data, calculating the number of cells updated per core per second. This 1D shock calculation did not include photoionisation or charge-exchange reactions (see text for details).
Current usage metrics show cumulative count of Article Views (full-text article views including HTML views, PDF and ePub downloads, according to the available data) and Abstracts Views on Vision4Press platform.
Data correspond to usage on the plateform after 2015. The current usage metrics is available 48-96 hours after online publication and is updated daily on week days.
Initial download of the metrics may take a while.