Fig. 16.
Download original image
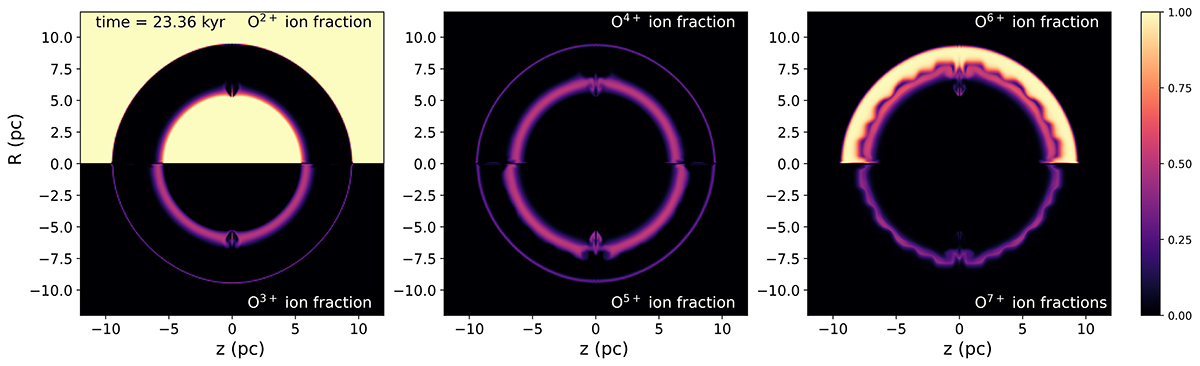
Ionisation profile of O2+ to O7+ ions from a two-dimensional simulation of the interaction between the WR wind and the remnant RSG wind, shown 23.36 kyr after the onset of the WR wind. The panels illustrate the ionisation fraction, YO, i on a linear scale, with white representing a oxygen completely in this ionisation state (YO, i = 1) and black denoting the zero abundance (YO, i = 0). The colour scale is shown at the far right of the plot.
Current usage metrics show cumulative count of Article Views (full-text article views including HTML views, PDF and ePub downloads, according to the available data) and Abstracts Views on Vision4Press platform.
Data correspond to usage on the plateform after 2015. The current usage metrics is available 48-96 hours after online publication and is updated daily on week days.
Initial download of the metrics may take a while.