Fig. 15.
Download original image
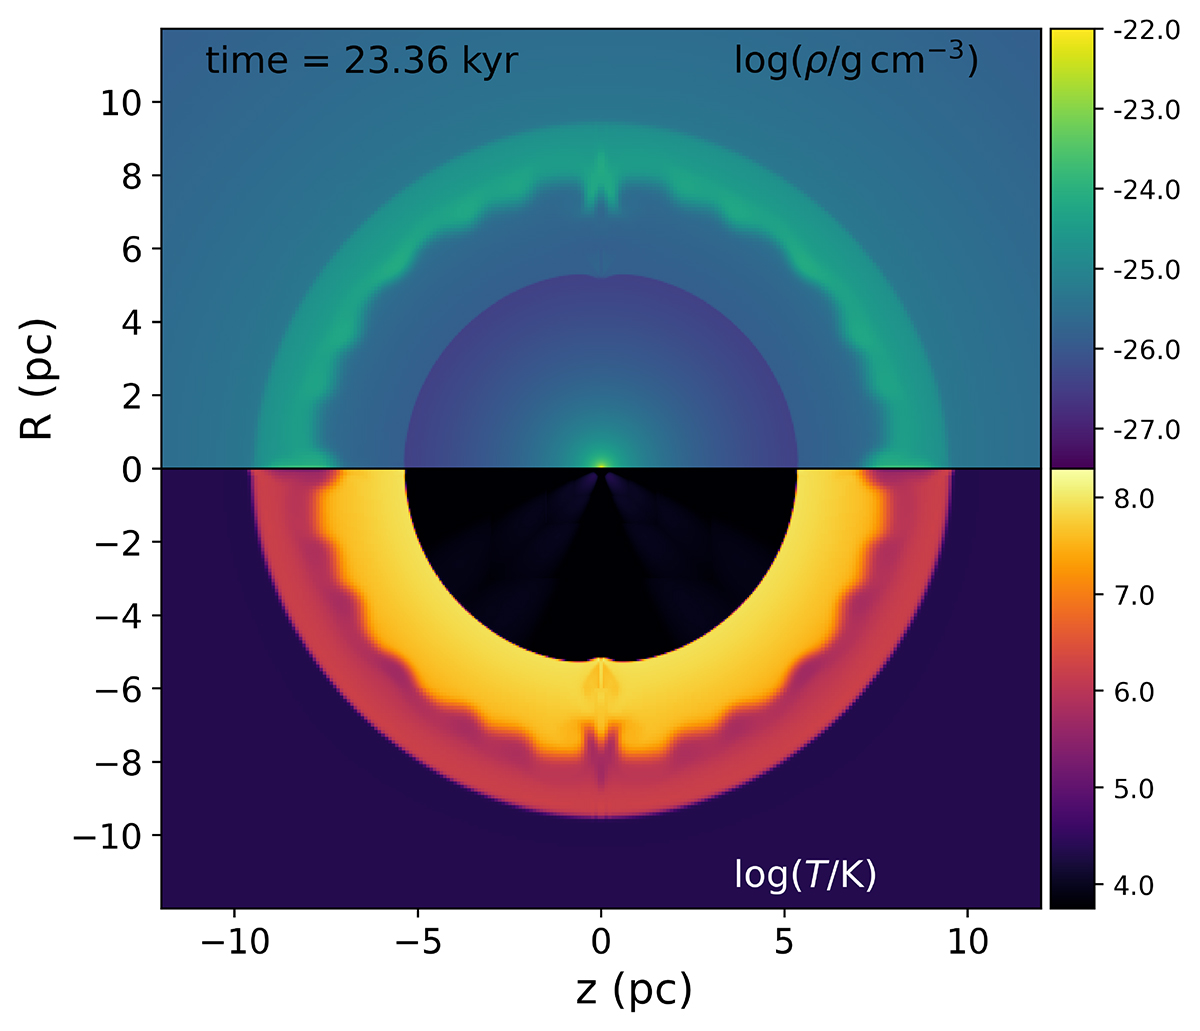
Snapshot from a two-dimensional simulation captures the interaction between the WR wind and the remnant wind from the earlier RSG phase. The image shows the flow quantities 23.36 kyr after the onset of the WR wind, with the star located at the origin. The top panel shows log10 of gas density (g cm−3) according to the colour scale shown, where brighter yellow regions indicate higher density, and darker purples represent lower density. The bottom panel shows log10 of temperature (in K) according to the colour scale displayed beside the plot.
Current usage metrics show cumulative count of Article Views (full-text article views including HTML views, PDF and ePub downloads, according to the available data) and Abstracts Views on Vision4Press platform.
Data correspond to usage on the plateform after 2015. The current usage metrics is available 48-96 hours after online publication and is updated daily on week days.
Initial download of the metrics may take a while.