Fig. 2.
Download original image
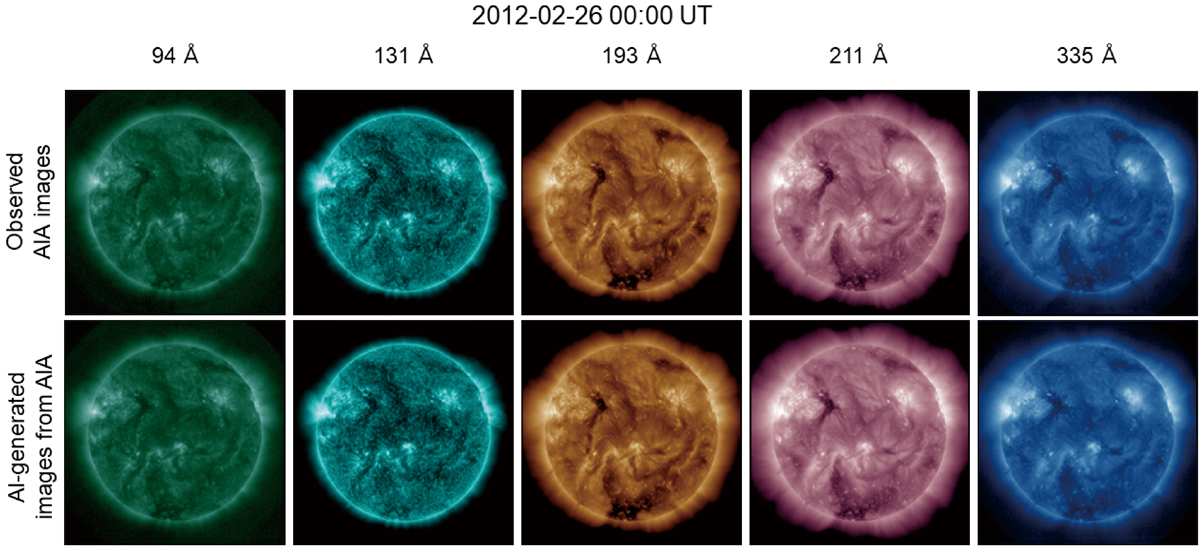
Comparison of observed and AI-generated AIA images at 00:00 UT on 2012 February 26. The top row shows observed AIA images in the 94, 131, 193, 211, and 335 Å channels. The bottom row shows AI-generated images from AIA 171 and 304 Å for the same channels. We note that the same conditions for each channel are used when plotting the images.
Current usage metrics show cumulative count of Article Views (full-text article views including HTML views, PDF and ePub downloads, according to the available data) and Abstracts Views on Vision4Press platform.
Data correspond to usage on the plateform after 2015. The current usage metrics is available 48-96 hours after online publication and is updated daily on week days.
Initial download of the metrics may take a while.