Fig. 9.
Download original image
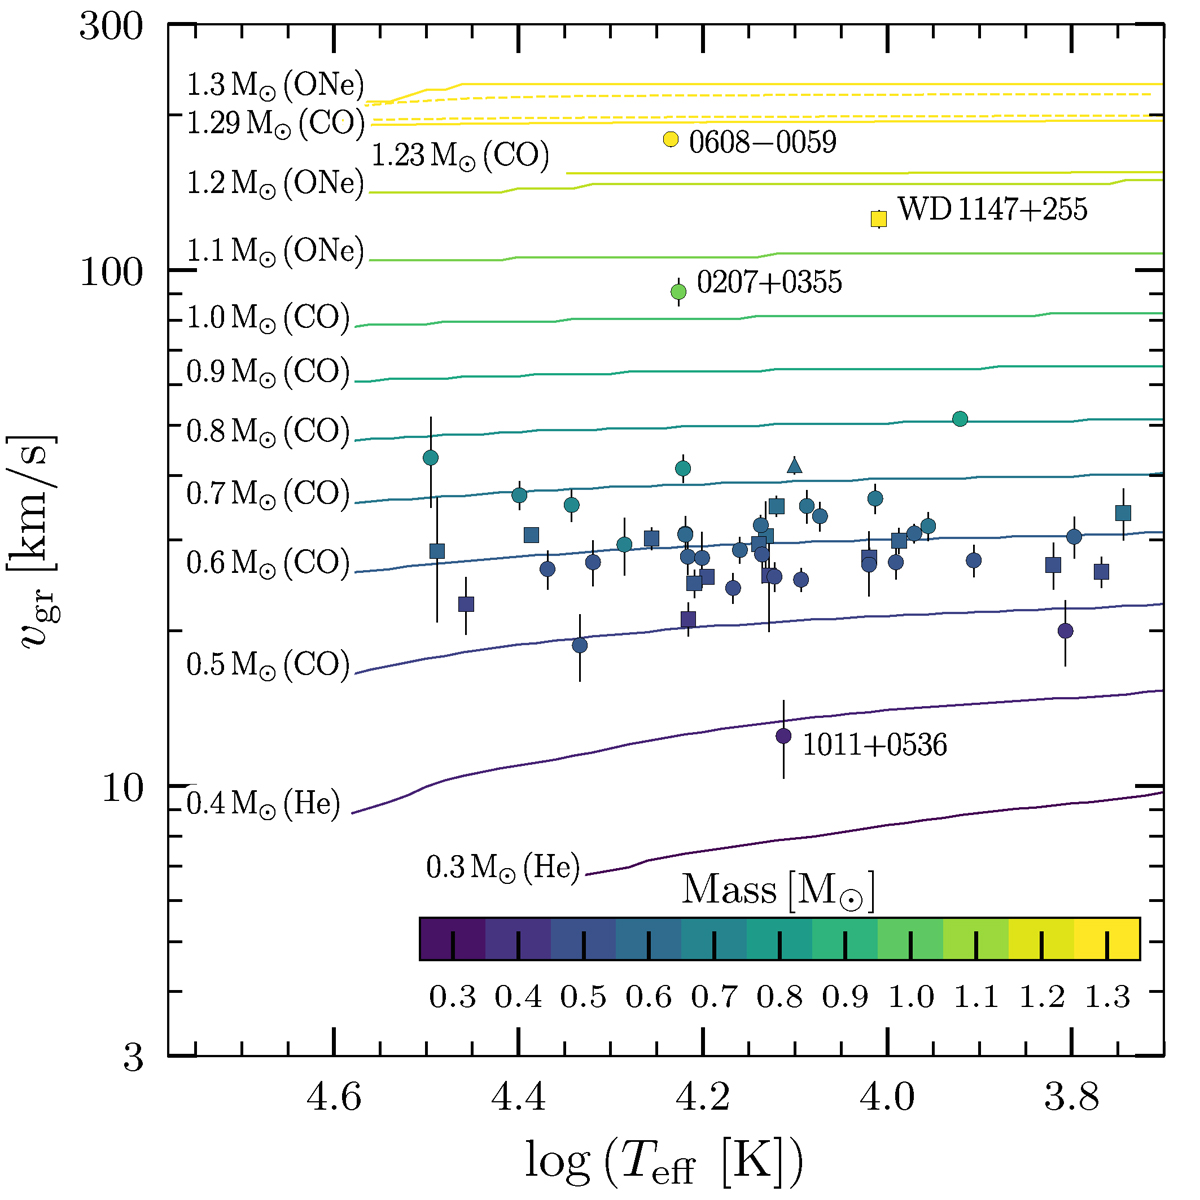
Distribution of gravitational redshifts as a function of log Teff. The theoretical curves are plotted as solid lines, which are labeled based on the corresponding mass and core compositions (He-, CO-, and ONe-cores Althaus et al. 2013; Camisassa et al. 2016, 2019). For reference, we also plot the models for two ultra-massive CO-core white dwarfs of 1.23 and 1.29 M⊙ (Camisassa et al. 2022) and the relativistic models for the 1.3 M⊙ ONe- and the 1.29 M⊙ CO-core white dwarfs (dashed curves; Althaus et al. 2022, 2023). The observed stars are color coded accordingly to their measured masses; the adopted symbols are the same as in Fig. 8. The four labeled stars are discussed in the text.
Current usage metrics show cumulative count of Article Views (full-text article views including HTML views, PDF and ePub downloads, according to the available data) and Abstracts Views on Vision4Press platform.
Data correspond to usage on the plateform after 2015. The current usage metrics is available 48-96 hours after online publication and is updated daily on week days.
Initial download of the metrics may take a while.