Fig. 7.
Download original image
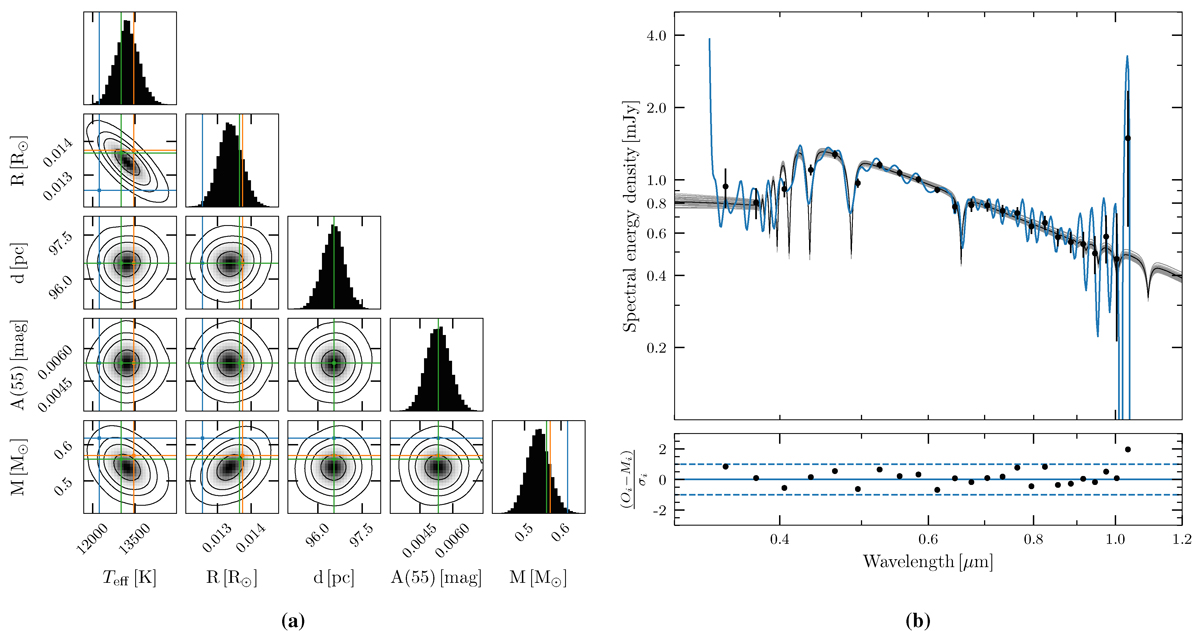
Results of the photometric analysis for the star 0319−7254. (a): Corner plot (Foreman-Mackey 2016) showing the correlations among the measured physical parameters. The colored lines respectively mark the estimated parameters obtained from the spectral analysis (blue: Koester models; orange: Tremblay models) or other works (green: the Gentile Fusillo et al. 2021 parameters as well as the parallax-based distance and the interstellar extinction from the 3D maps). (b): The best-fitting SED (black line) is compared to the Gaia BP/RP spectrum (cyan). The gray shaded line represents fifty random draws from the parameters distributions (using the Koester models). The bottom-panel shows the residuals between the model and the observed data.
Current usage metrics show cumulative count of Article Views (full-text article views including HTML views, PDF and ePub downloads, according to the available data) and Abstracts Views on Vision4Press platform.
Data correspond to usage on the plateform after 2015. The current usage metrics is available 48-96 hours after online publication and is updated daily on week days.
Initial download of the metrics may take a while.