Fig. 5.
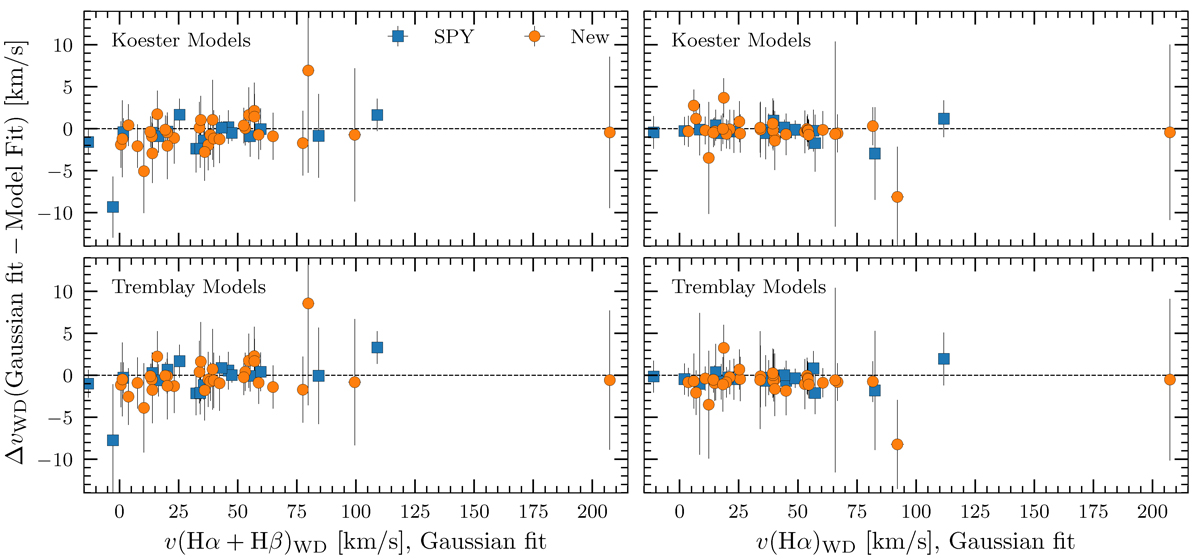
Download original image
Comparison among the radial velocity estimates. On the x-axes we plot the radial velocities measured with the second method, which fits two Gaussian functions and a quadratic polynomial to the line cores and wings. The y-axes display the difference between the Gaussian fit and the first method that uses the spectral templates to fit the line wings, respectively for the Koester and Tremblay models on the left and right panels. The left panels compare the Hα+Hβ measurements, while the right panels show the same comparison for the Hα line. The colors and shapes of the symbols are the same as in Fig. 3.
Current usage metrics show cumulative count of Article Views (full-text article views including HTML views, PDF and ePub downloads, according to the available data) and Abstracts Views on Vision4Press platform.
Data correspond to usage on the plateform after 2015. The current usage metrics is available 48-96 hours after online publication and is updated daily on week days.
Initial download of the metrics may take a while.