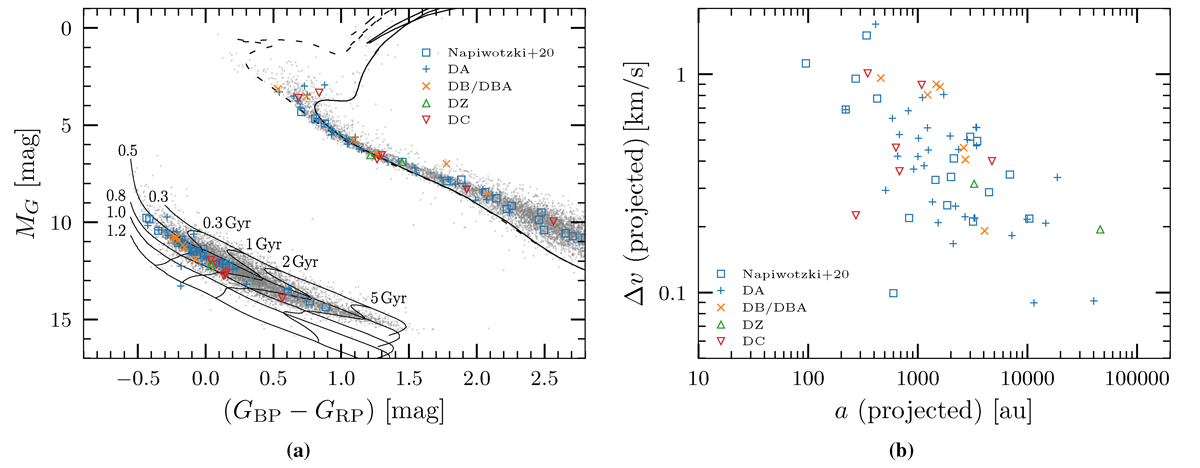
Fig. 1.
Download original image
Properties of the selected targets. Symbols and colors are explained in the legends. (a): Color-magnitude diagram of the studied sample. For reference, we plot the white dwarf cooling tracks for He-, CO-, and oxygen-neon (ONe)-core white dwarfs (Althaus et al. 2013; Camisassa et al. 2016, 2019) and the isochrones, which we converted to the Gaia magnitudes by means of synthetic spectra (Koester 2010); the corresponding masses, in Solar units, and cooling ages are labeled. The solar metallicity BaSTI isochrones with [Fe/H] = +0.06 (Hidalgo et al. 2018) are also plotted at 1 and 10 Gyr (dashed and solid curves, respectively). (b): Projected velocity difference plotted against projected orbital semi-major axis of the studied binaries.
Current usage metrics show cumulative count of Article Views (full-text article views including HTML views, PDF and ePub downloads, according to the available data) and Abstracts Views on Vision4Press platform.
Data correspond to usage on the plateform after 2015. The current usage metrics is available 48-96 hours after online publication and is updated daily on week days.
Initial download of the metrics may take a while.