Fig. A.1.
Download original image
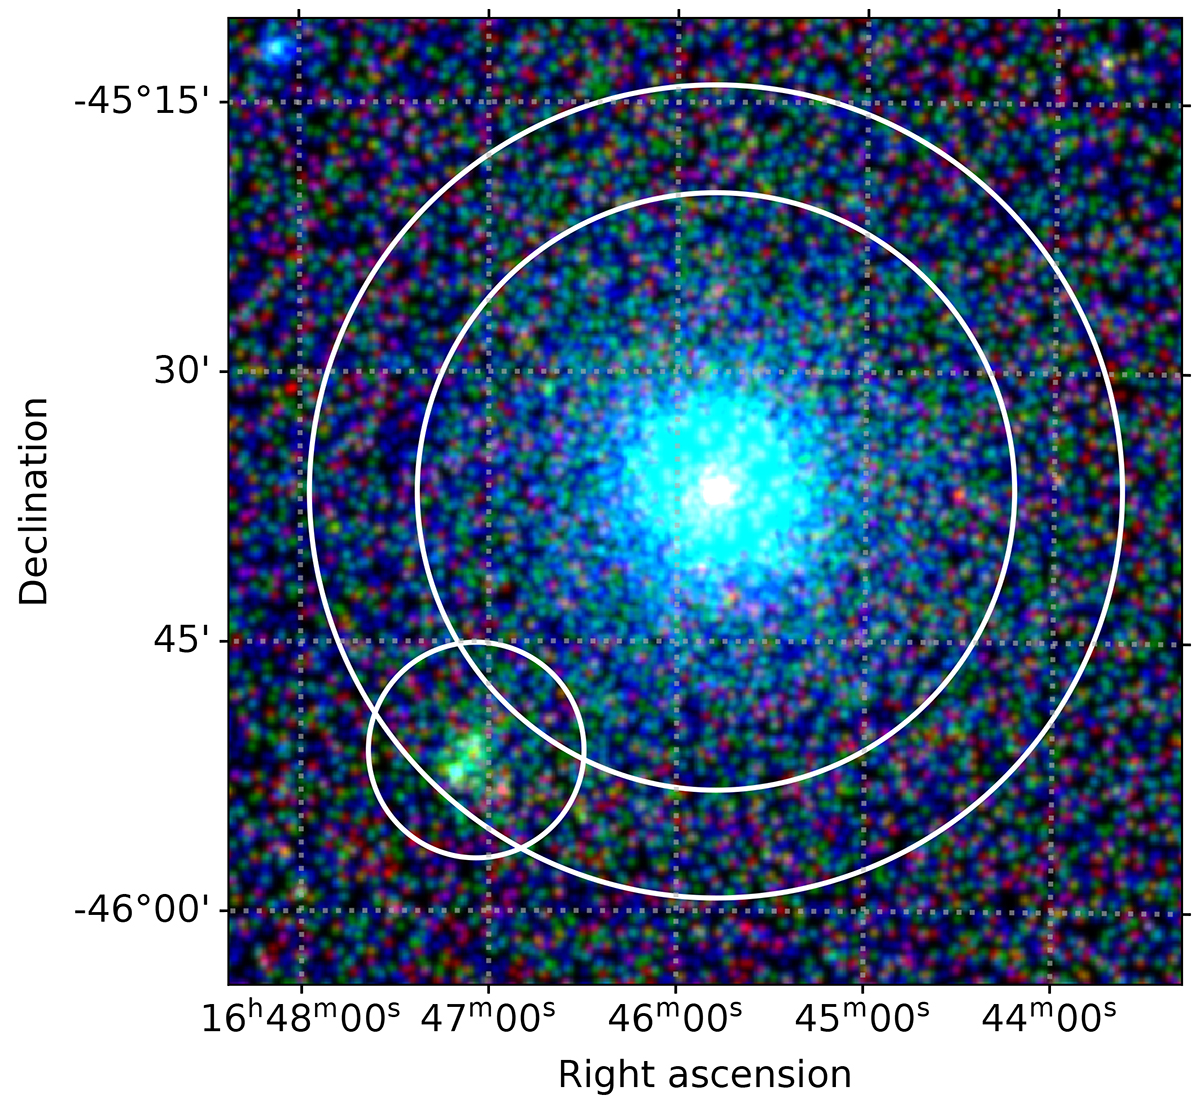
eROSITA RGB image of the surroundings of Wd 1. Red, green, and blue colors correspond to 0.7 to 1.1keV, 1.1 to 2.3keV, and 2.3 to 10keV, respectively. The image was smoothed using a Gaussian kernel with standard deviation 10 arcsec. The large annulus indicates the background region for the Wd 1 spectral fit, from which the white circle around Wd 1 itself was excluded.
Current usage metrics show cumulative count of Article Views (full-text article views including HTML views, PDF and ePub downloads, according to the available data) and Abstracts Views on Vision4Press platform.
Data correspond to usage on the plateform after 2015. The current usage metrics is available 48-96 hours after online publication and is updated daily on week days.
Initial download of the metrics may take a while.