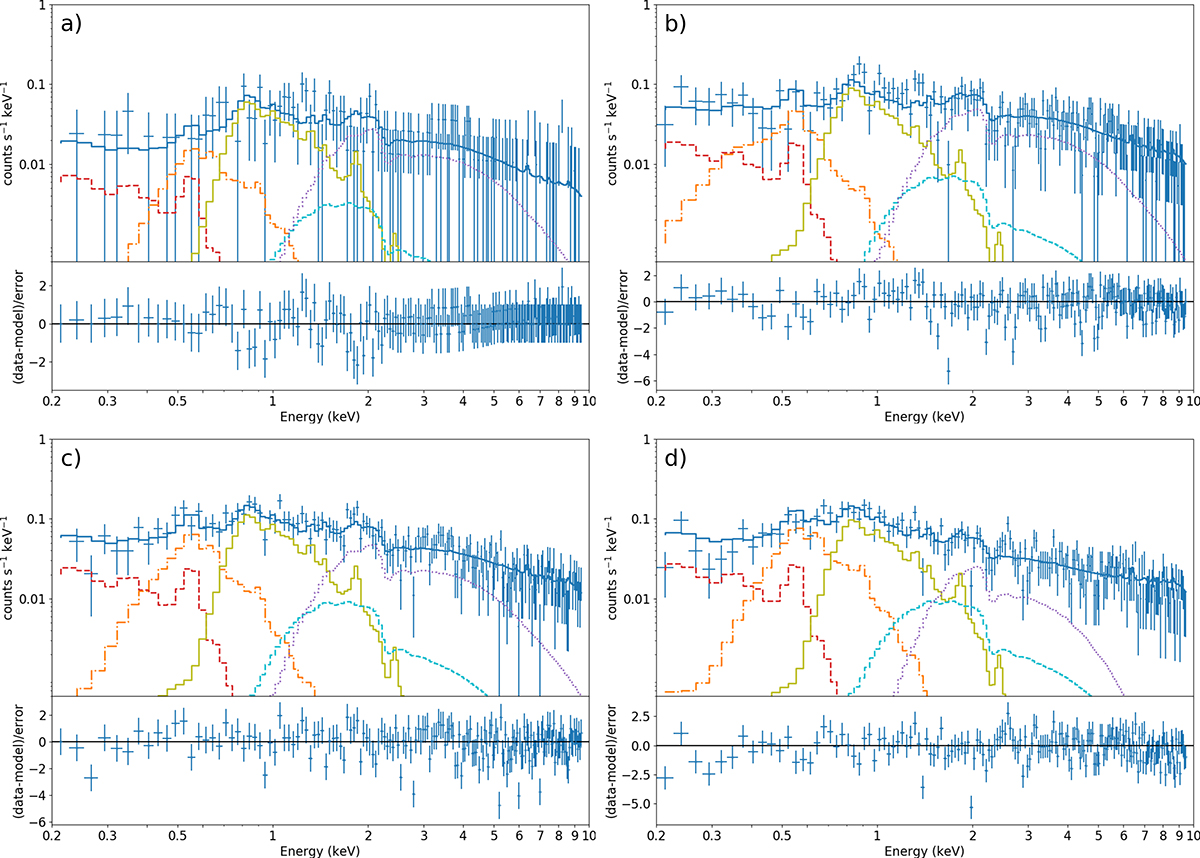
Fig. 7.
Download original image
Background fits to the four source regions 1, 2, 3, and 4 in panels (a), (b), (c), and (d), respectively. The data are given in blue. Upper panels: The main model components are shown using different colors and line styles: The LHB is red and dashed, the CGM is orange and dashed-dotted, the corona is yellow and solid, the CXB is light blue and dashed, and the GX 340+0 halo components are purple and dotted. Lower panels: Normalized residuals of the fits.
Current usage metrics show cumulative count of Article Views (full-text article views including HTML views, PDF and ePub downloads, according to the available data) and Abstracts Views on Vision4Press platform.
Data correspond to usage on the plateform after 2015. The current usage metrics is available 48-96 hours after online publication and is updated daily on week days.
Initial download of the metrics may take a while.