Open Access
Fig. 6.
Download original image
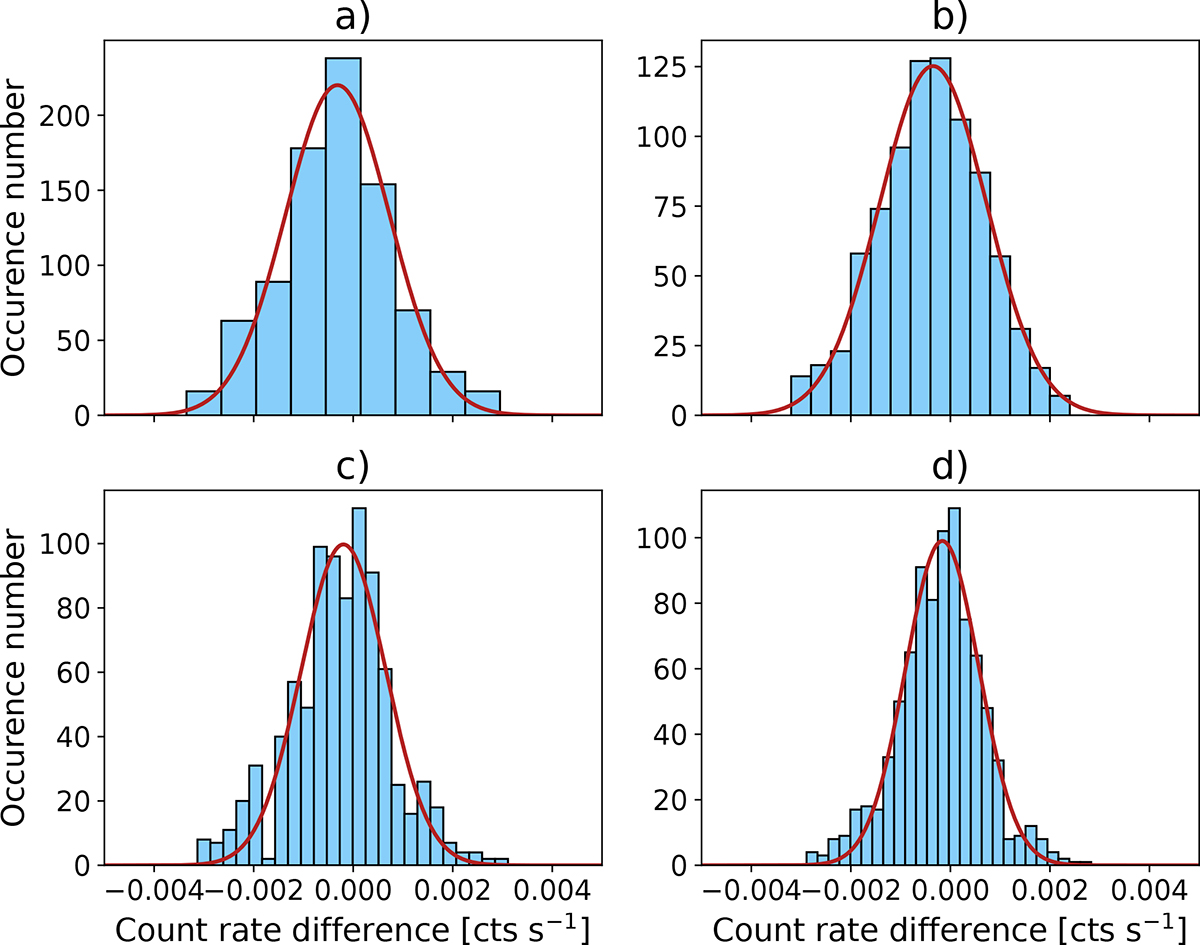
Histograms of the residuals obtained via subtracting background from source spectra in blue with corresponding Gaussian fits in red. Region pairs 1, 2, 3, and 4 correspond to panels (a), (b), (c), and (d), respectively. For each region pair, we employed the minimum bin size that resulted in no empty bins
Current usage metrics show cumulative count of Article Views (full-text article views including HTML views, PDF and ePub downloads, according to the available data) and Abstracts Views on Vision4Press platform.
Data correspond to usage on the plateform after 2015. The current usage metrics is available 48-96 hours after online publication and is updated daily on week days.
Initial download of the metrics may take a while.