Fig. 4.
Download original image
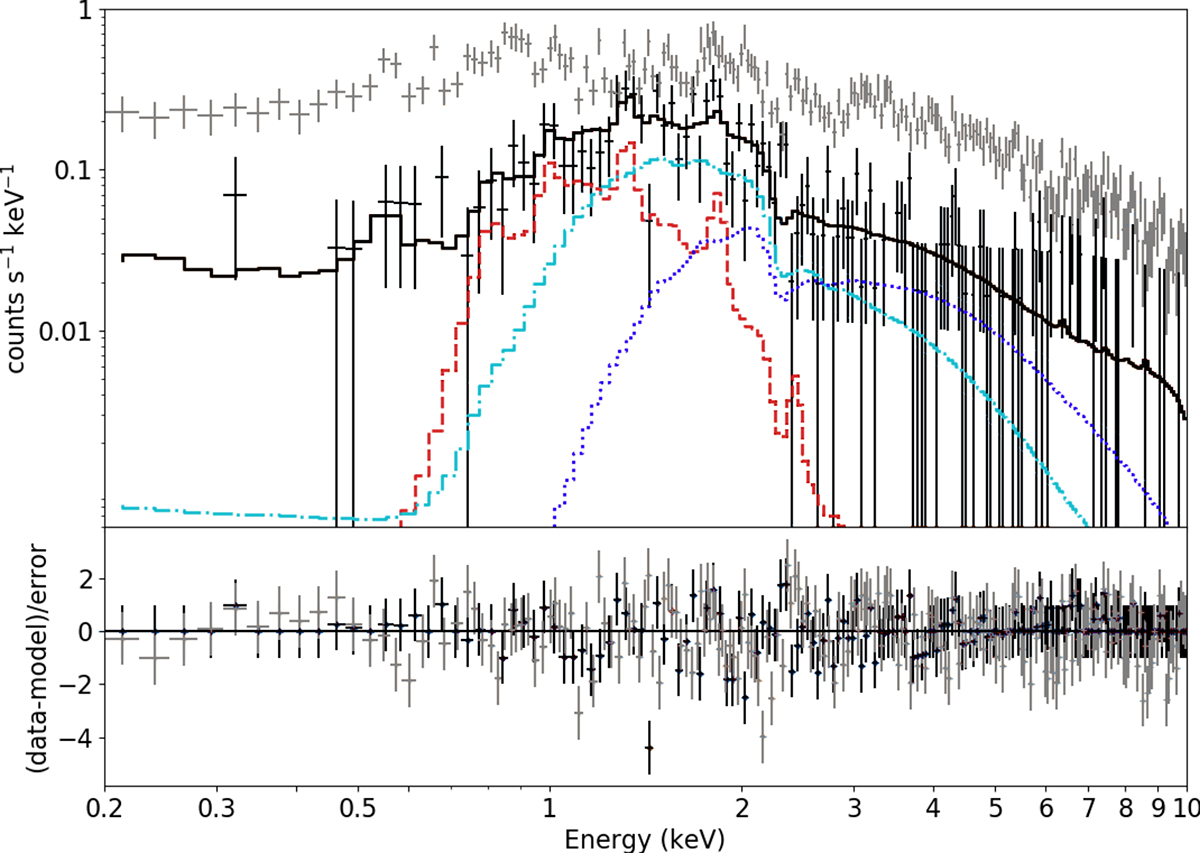
Results of the apec+pl fit to the spectrum of Wd 1. Upper panel: Black data points are the source spectrum, gray data points are the background as measured in the background region. Both are binned to a minimum significance of 5σ. The overall model is given in black, while the apec component is red and dashed, the powerlaw component is light blue and dashed-dotted, and the GX 340+0 halo component is dark blue and dotted. Lower panel: Normalized residuals of the source spectrum (black) and of the background spectrum (gray).
Current usage metrics show cumulative count of Article Views (full-text article views including HTML views, PDF and ePub downloads, according to the available data) and Abstracts Views on Vision4Press platform.
Data correspond to usage on the plateform after 2015. The current usage metrics is available 48-96 hours after online publication and is updated daily on week days.
Initial download of the metrics may take a while.