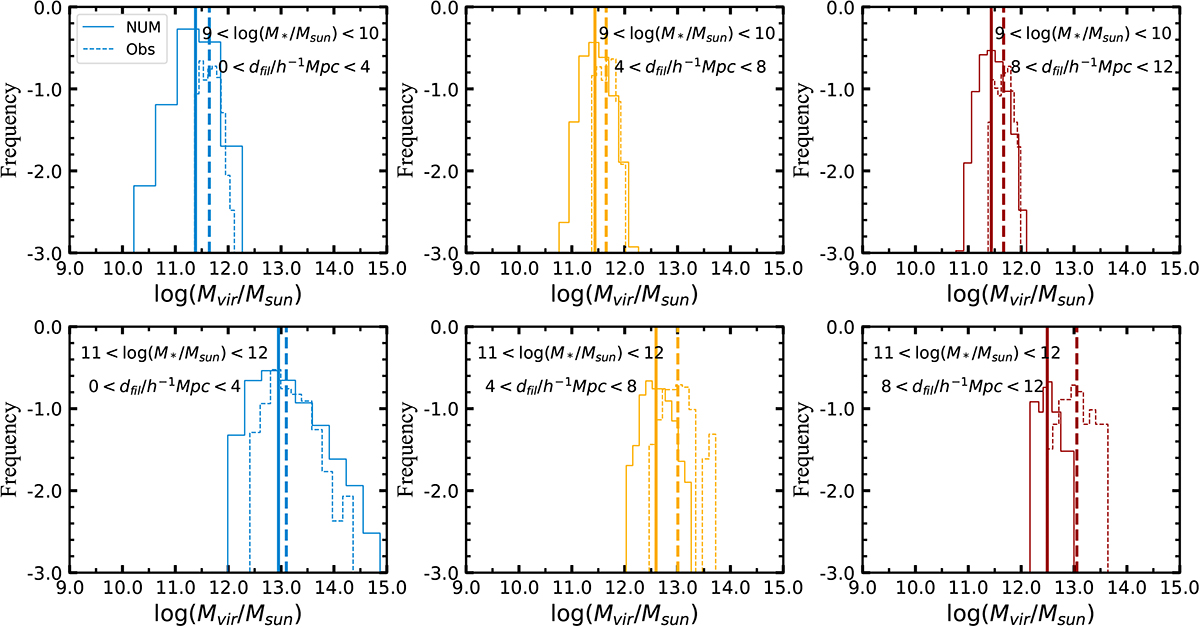
Fig. 7.
Download original image
Comparison of halo-mass distribution for star-forming central galaxies in NUM model (solid lines) and observations (dashed lines) at z = 0. We show the mean halo masses for each population as vertical lines, solid lines are used for the NUM model, and dashed lines are used for observations. The top row shows galaxies with 9 < log(M*/M⊙) < 10, and the bottom row shows galaxies with 11 < log(M*/M⊙) < 12. From left to right, we show the distribution of galaxies with 0 < dfil/h−1 Mpc < 4 (left panels), 4 < dfil/h−1 Mpc < 8 (middle panels), and 8 < dfil/h−1 Mpc < 12 (right panels), respectively.
Current usage metrics show cumulative count of Article Views (full-text article views including HTML views, PDF and ePub downloads, according to the available data) and Abstracts Views on Vision4Press platform.
Data correspond to usage on the plateform after 2015. The current usage metrics is available 48-96 hours after online publication and is updated daily on week days.
Initial download of the metrics may take a while.