Fig. 6.
Download original image
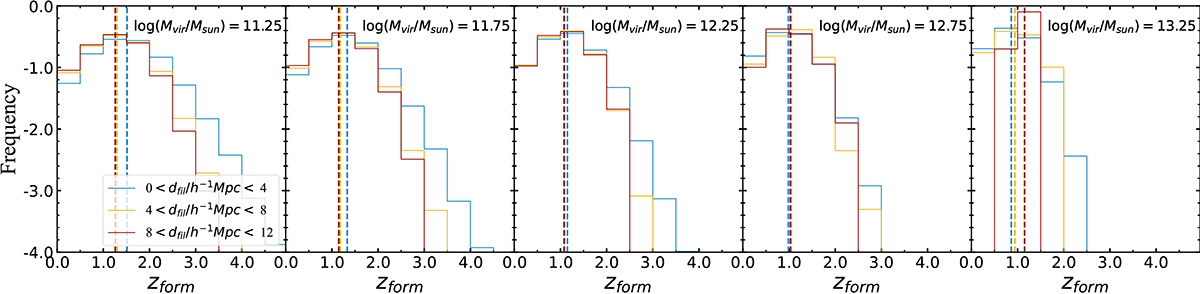
Distribution of halo-formation time (zform) in NUM model. From left to right we show the distribution of haloes with log(Mvir/M⊙) = 11.25, 11.75, 12.25, 12.75, 13.25, respectively. We show the mean zform for each population as a vertical dashed line. Blue, orange, and red ones represent galaxies with 0 < dfil/h−1 Mpc < 4, 4 < dfil/h−1 Mpc < 8, 8 < dfil/h−1 Mpc < 12, respectively.
Current usage metrics show cumulative count of Article Views (full-text article views including HTML views, PDF and ePub downloads, according to the available data) and Abstracts Views on Vision4Press platform.
Data correspond to usage on the plateform after 2015. The current usage metrics is available 48-96 hours after online publication and is updated daily on week days.
Initial download of the metrics may take a while.