Fig. 5.
Download original image
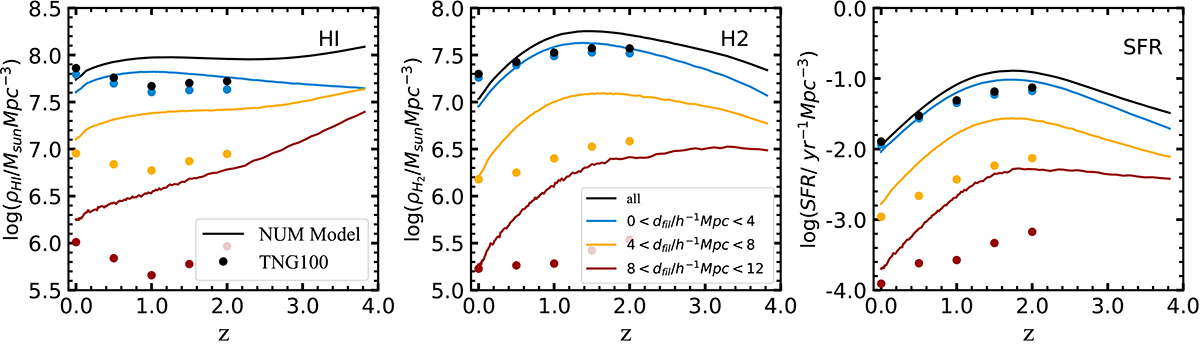
Evolution of H I (left panel) H2 (middle panel) mass density and SFR (right panel) in NUM model (solid lines) and TNG100 (filled circles). The results of different distance to filaments are shown as different colours: black for all galaxies, blue for 0 < dfil/h−1 Mpc < 4, orange for 4 < dfil/h−1 Mpc < 8, and red for 8 < dfil/h−1 Mpc < 12.
Current usage metrics show cumulative count of Article Views (full-text article views including HTML views, PDF and ePub downloads, according to the available data) and Abstracts Views on Vision4Press platform.
Data correspond to usage on the plateform after 2015. The current usage metrics is available 48-96 hours after online publication and is updated daily on week days.
Initial download of the metrics may take a while.