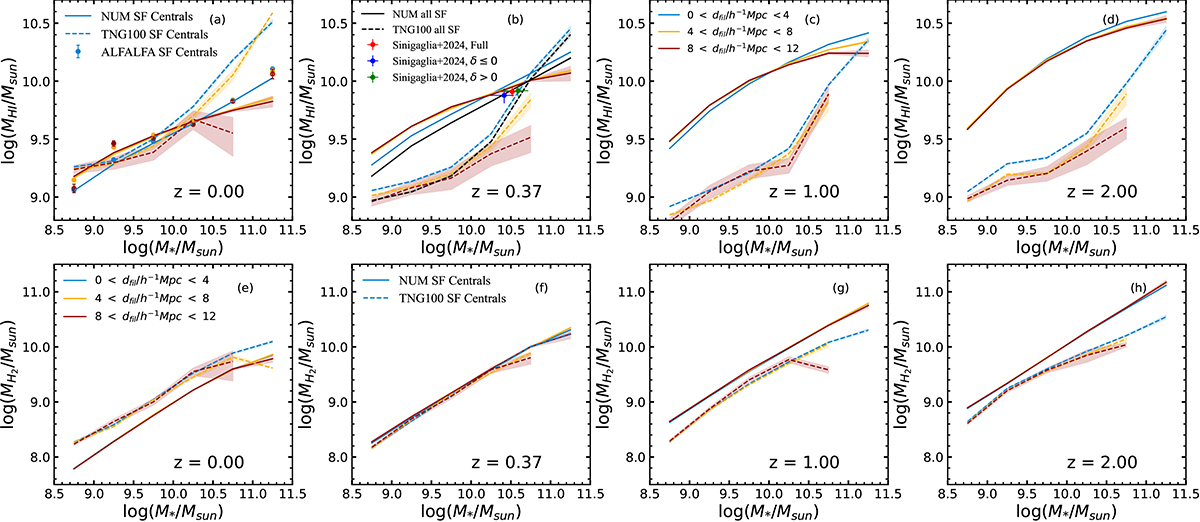
Fig. 4.
Download original image
Comparisons of H I – (top row) and H2- (bottom row) stellar-mass relations for star-forming (SF) central galaxies between NUM model and TNG100 for z = 0, z = 0.37, z = 1, and z = 2 from left to right panels. NUM and TNG100 results are shown as solid and dashed lines. The bootstrap errors are shown in the shaded area. As TNG100 does not have data for z = 0.37, we use z = 0.5 instead in panels b and f. We show observational measurements in Guo et al. (2021) as filled circles with error bars for z = 0 in panel a. In panel b, we adopt the full galaxy sample, galaxies with δ ≤ 0, and those with δ > 0 in Sinigaglia et al. (2024) as red, blue, and green circles with error bars, respectively. We add the relation of all star-forming galaxies in the NUM model and TNG100 in panel b as black solid and dashed lines for a fair comparison with Sinigaglia et al. (2024). The results of different distances from the filaments are shown as different colours: blue for 0 < dfil/h−1 Mpc < 4, orange for 4 < dfil/h−1 Mpc < 8, and red for 8 < dfil/h−1 Mpc < 12.
Current usage metrics show cumulative count of Article Views (full-text article views including HTML views, PDF and ePub downloads, according to the available data) and Abstracts Views on Vision4Press platform.
Data correspond to usage on the plateform after 2015. The current usage metrics is available 48-96 hours after online publication and is updated daily on week days.
Initial download of the metrics may take a while.